Most software that claims to have JSON or NoSQL support can deal with tabular JSON or JSON with a small amount of nesting. Precog makes it easy and fast to work with any amount of nesting and dimensionality.
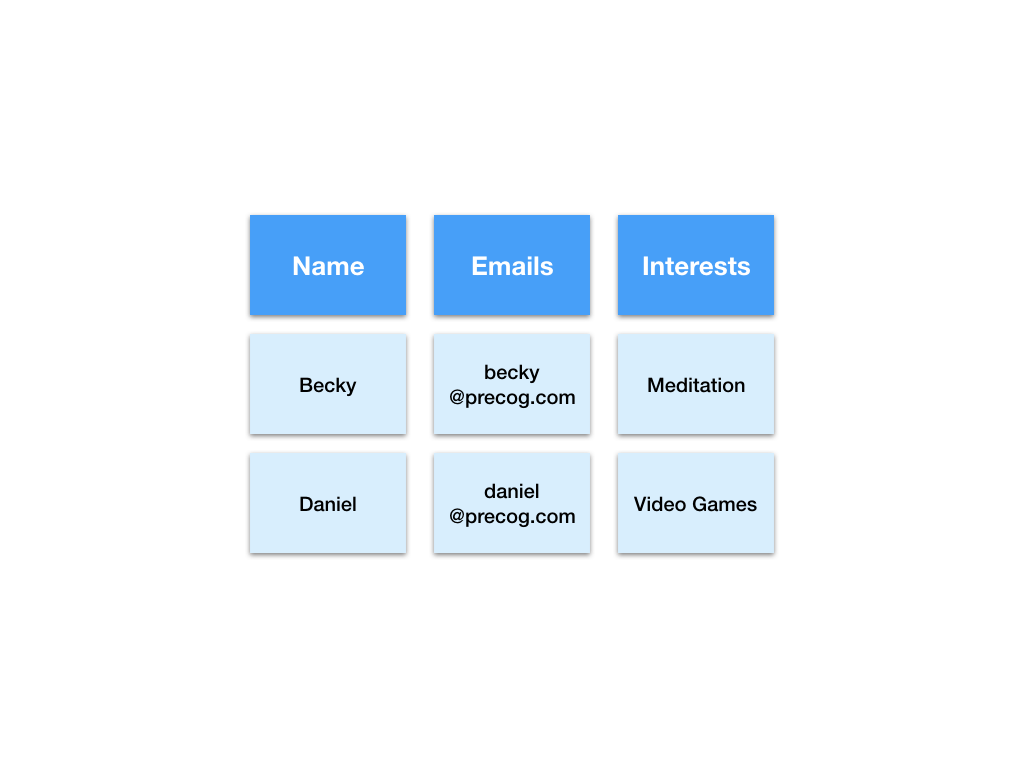
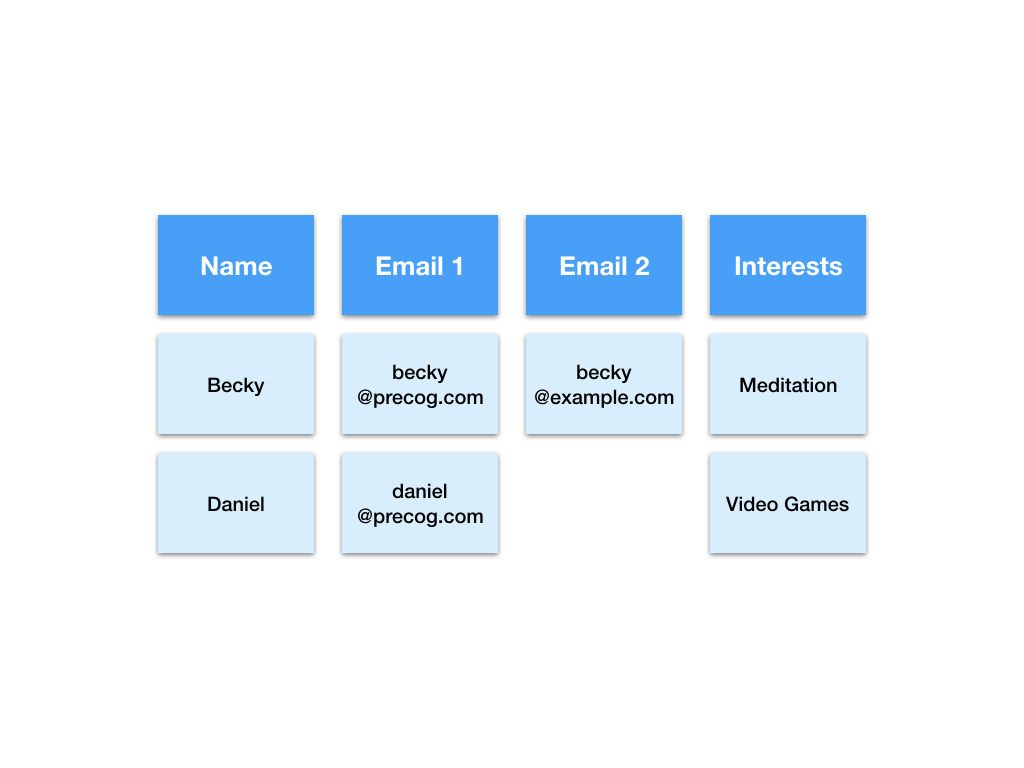
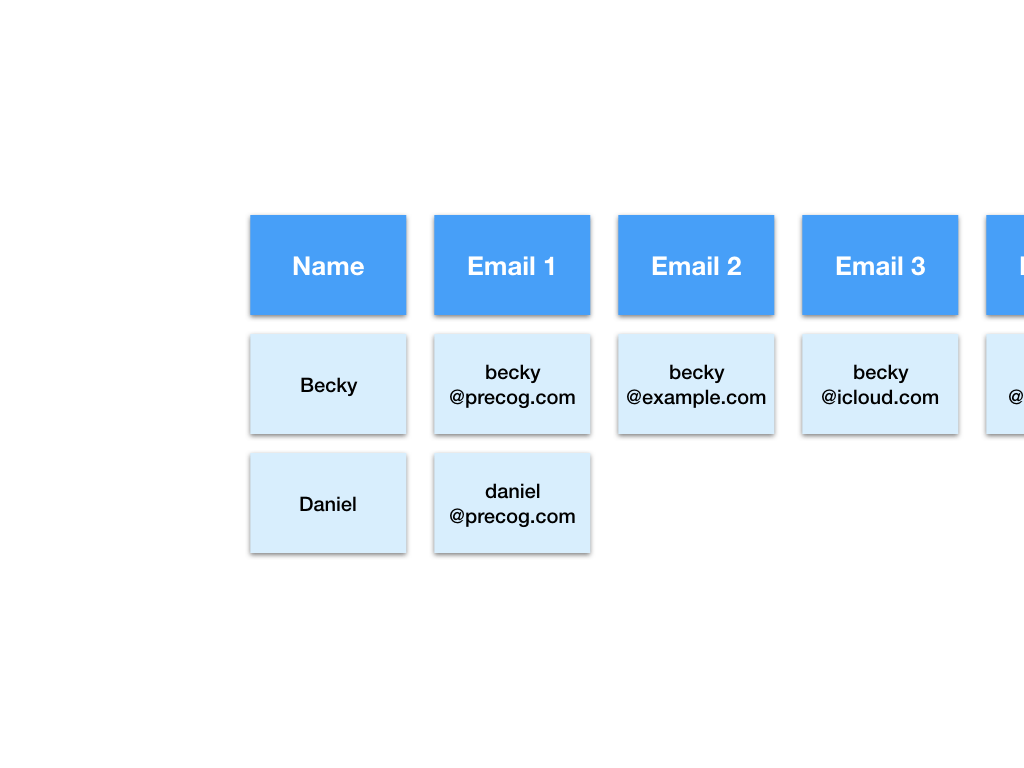
Here is a visualisation of a tabular JSON dataset that contains people’s names, email addresses and interests.
But what if Becky has two email addresses?
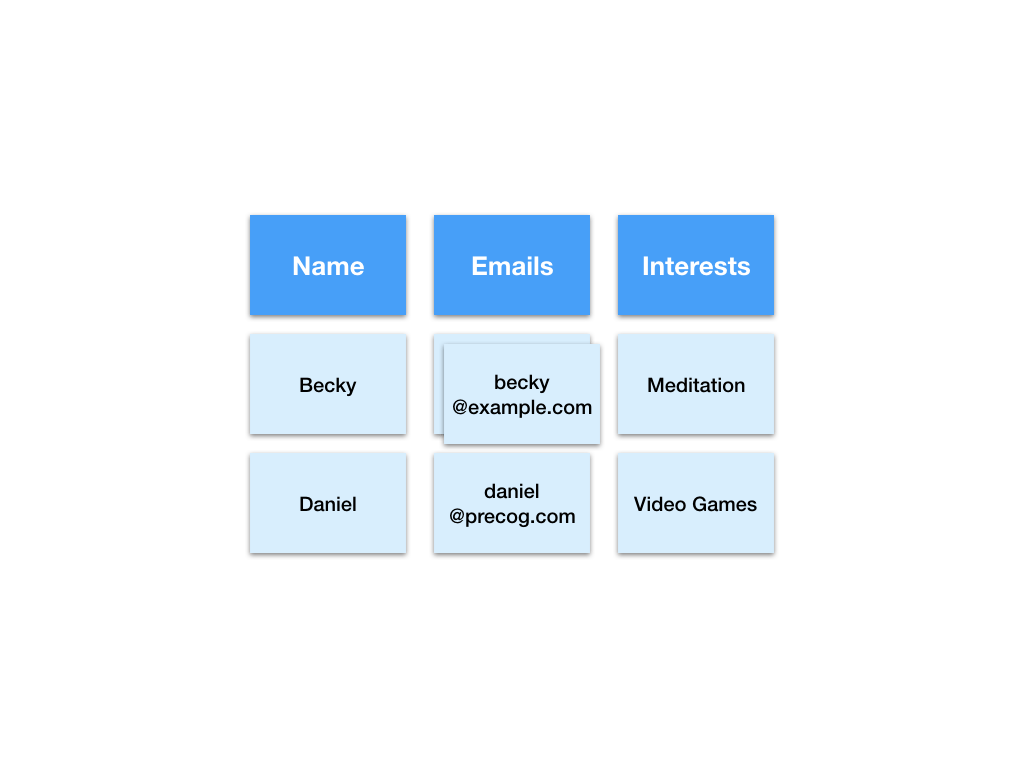
We just added a new dimension to the data.
Previously there were two dimensions. The person dimension (Becky, Daniel) and the field dimension (Name, Emails, Interests). Now there is a third dimension, the email dimension.
SQL, visualisation, reporting and machine learning software operate in two dimensions. Therefore before we can analyse or manipulate the data it must first be made two dimensional.
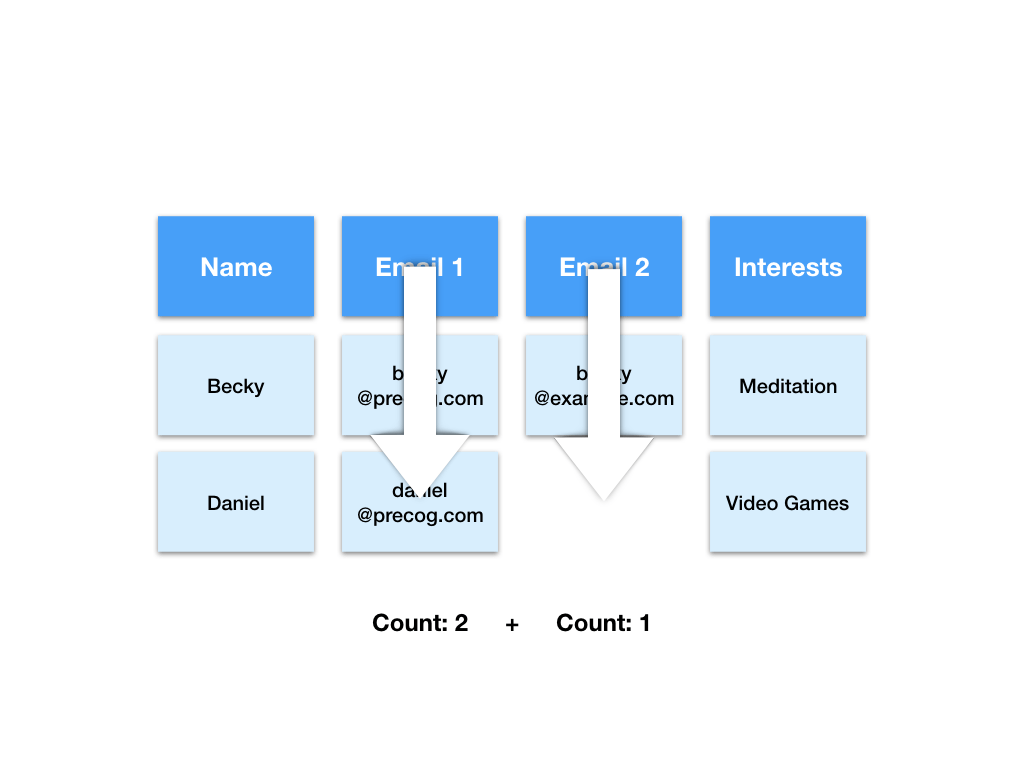
There are a number of ways we could tabulate this data. For example we could add an extra column to account for the second email address.
This is now a two dimensional table but there are some downsides to this representation.
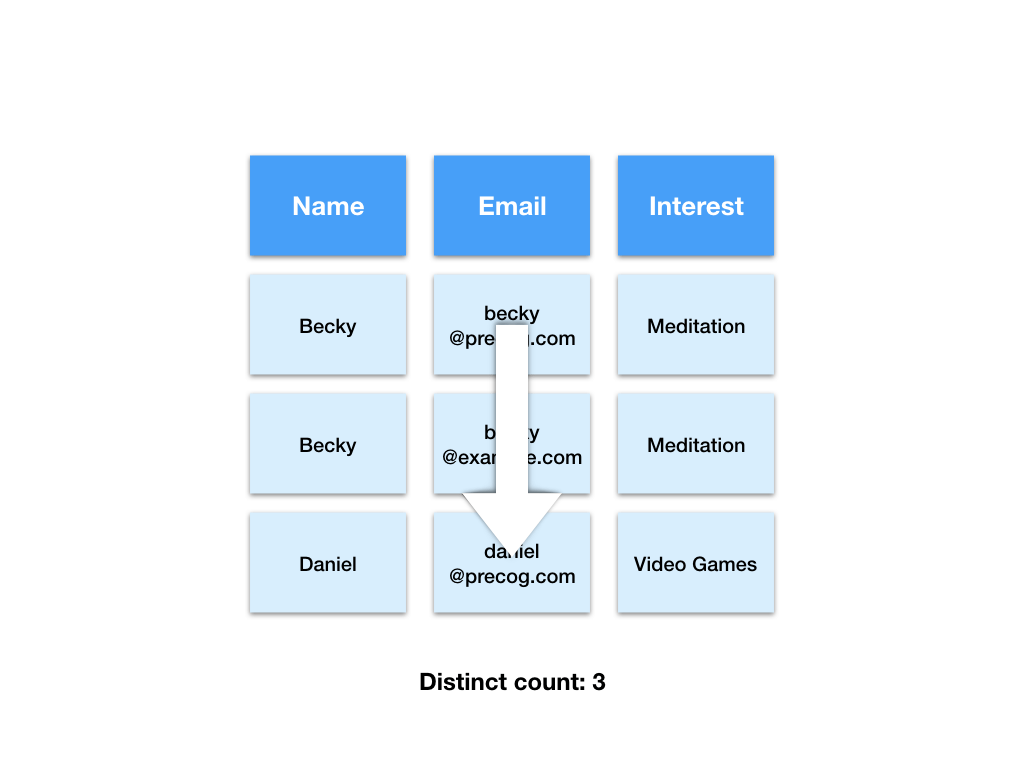
Say we want to count the total number of email addresses. SQL, visualisation, reporting software counts down columns. As such we must count both columns separately and sum the totals. This means more work for us and extra processing time for our computers.
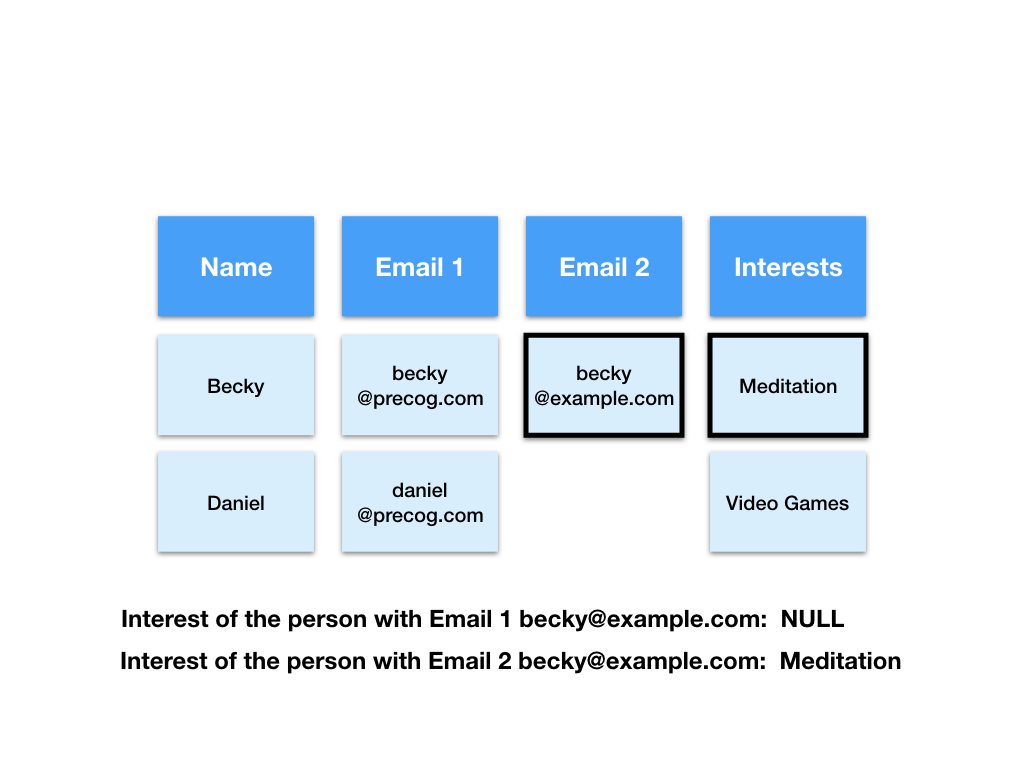
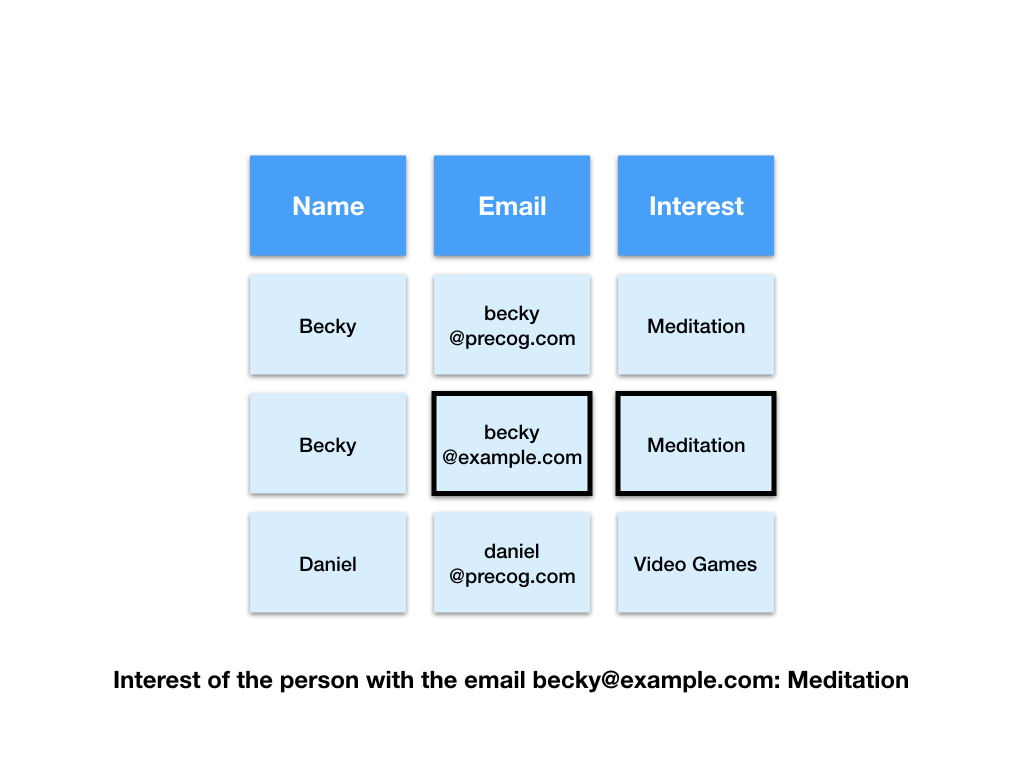
Say we want to find the interest of the person with the email “[email protected]”. Using this representation of the data we will need to search both columns to find the matching row. This means more work for us and extra processing time for our computers.
What if Becky had more than two email addresses?
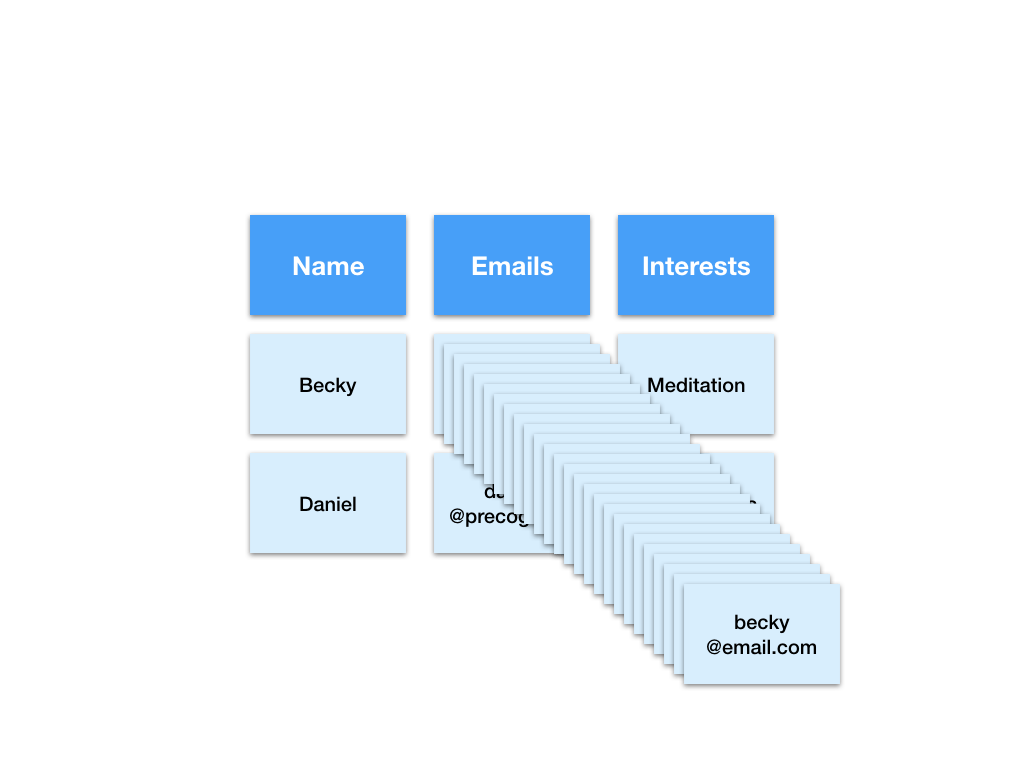
Representing this data by adding extra columns means our table and everything that relies on it (analyses, reports, queries, visualisations…) will all need to be updated every time someone beats the high score of number of email addresses. This means even more work for us and even more processing time for our computers.
Let’s check out the original data again and try a different representation.

Here we have split the dataset into two tables. One for emails and another for interests.
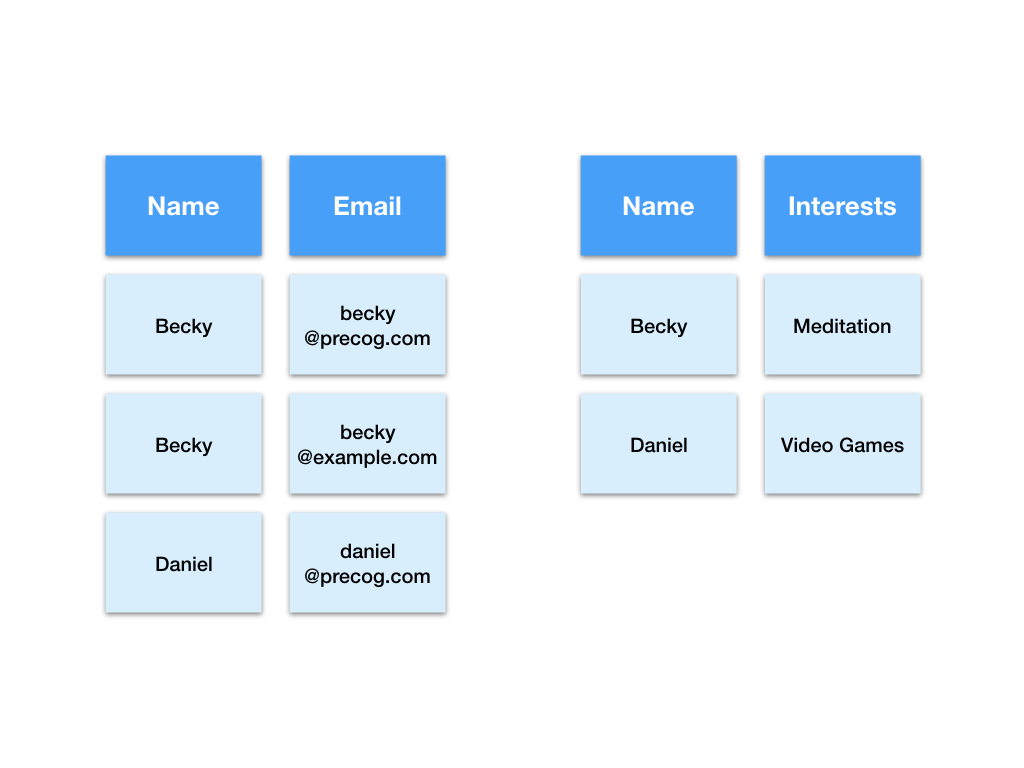
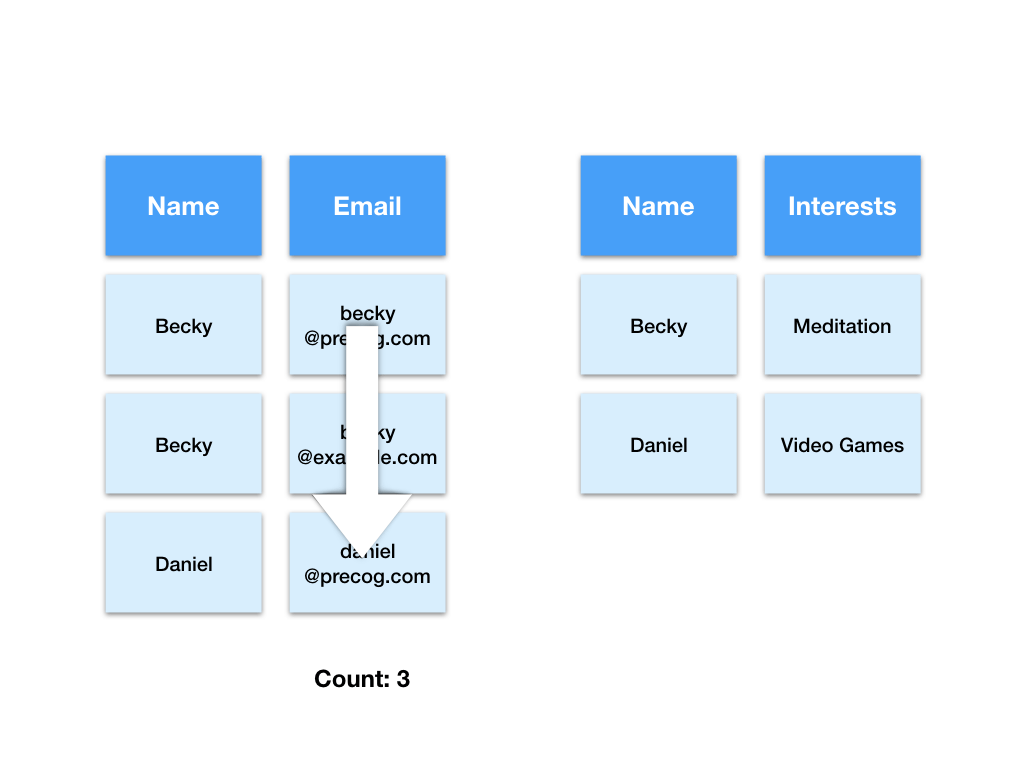
This solves the problems we had with counting as we can simply count the number of values in the email column. When more email addresses are added we simply get more rows in the emails table.
You may have also noticed there are fewer empty (null) values than in the previous representation.
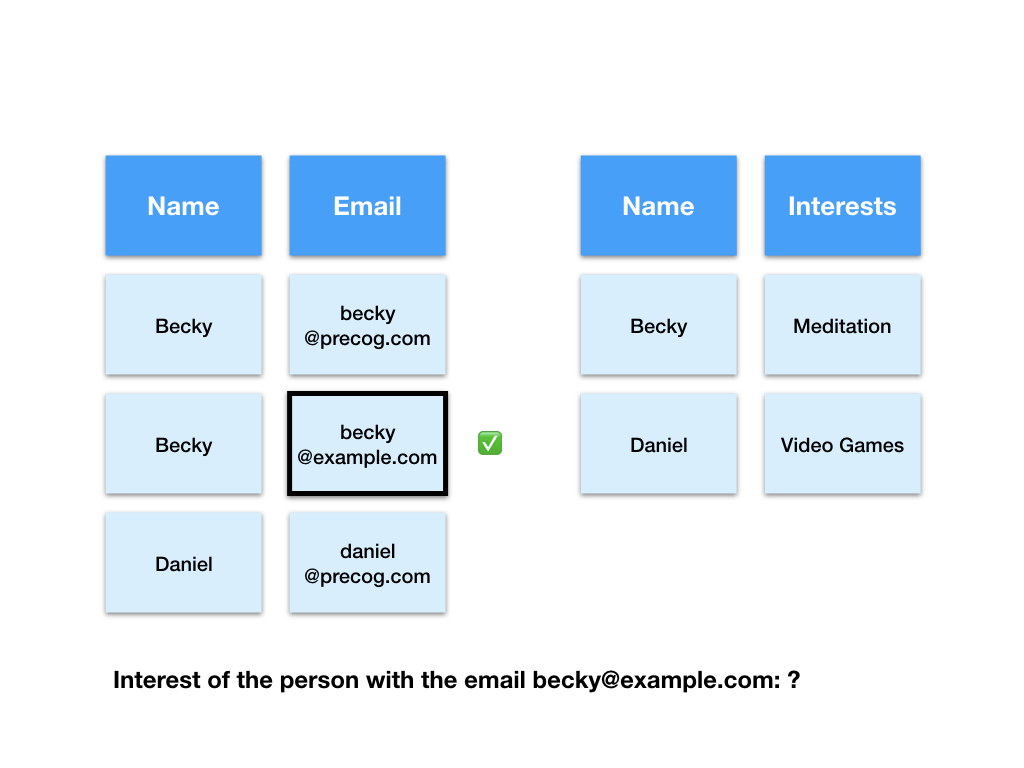
Next let’s try to find the interest of the person with the email “[email protected]”.
First the computer has to find the row with the email “[email protected]” in the emails table.
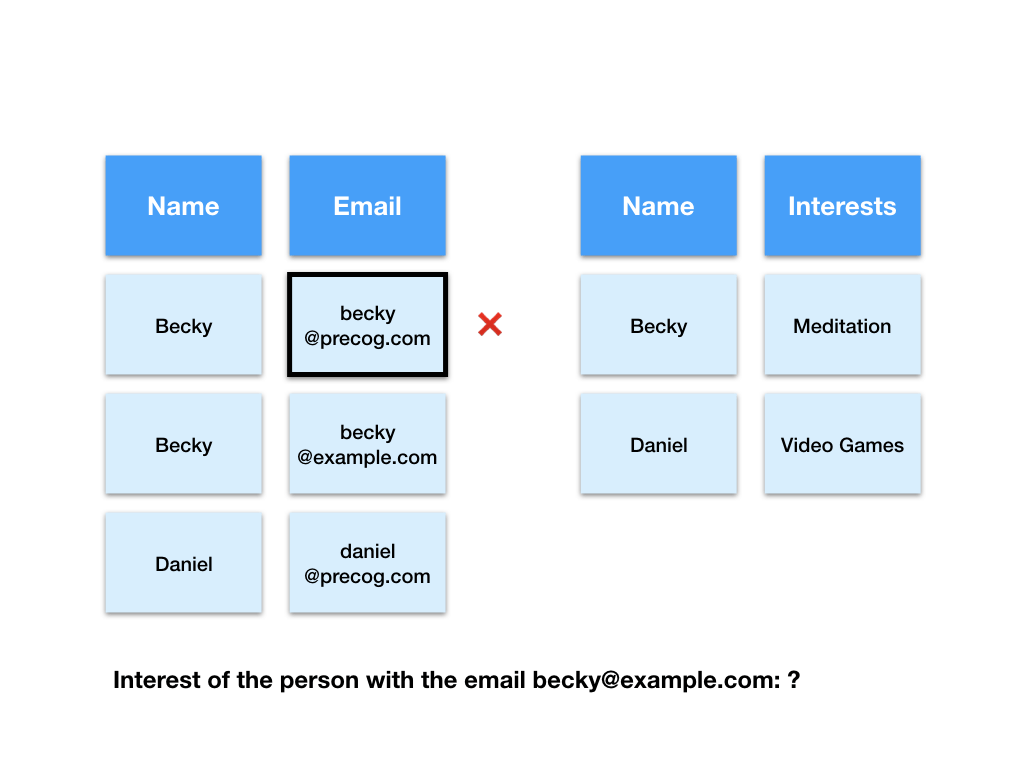
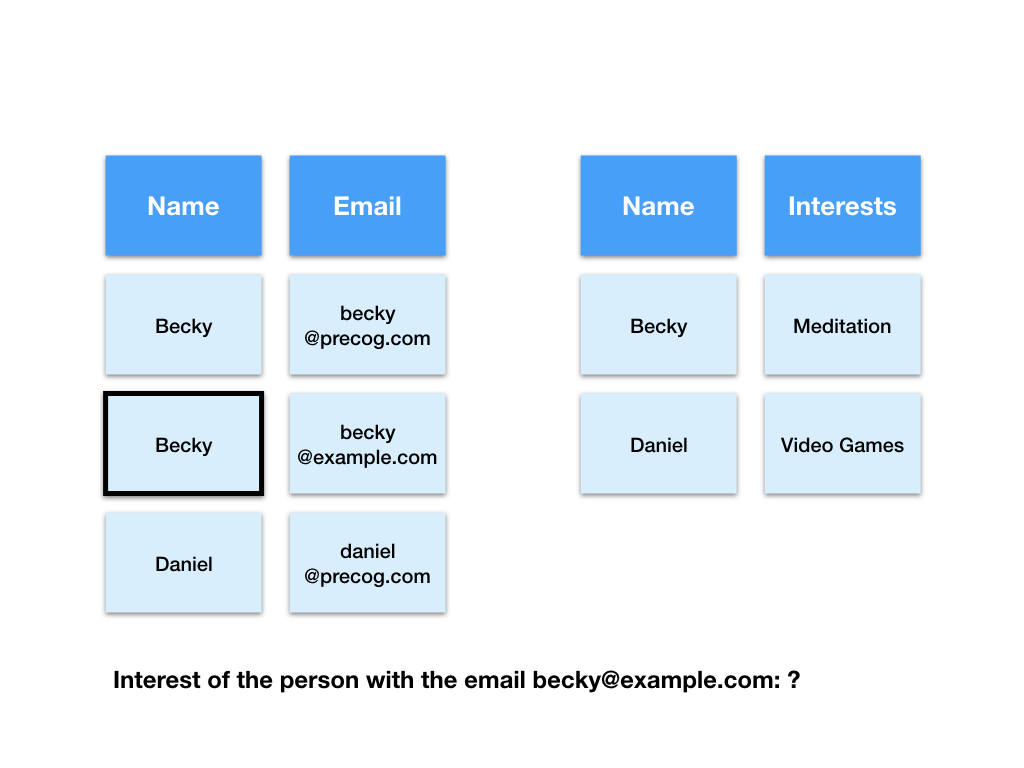
Next the computer takes the value of the name field in that row and uses it to find the matching row in the interests table.

Finally the computer gives us the value of the interests field in that row as the answer. 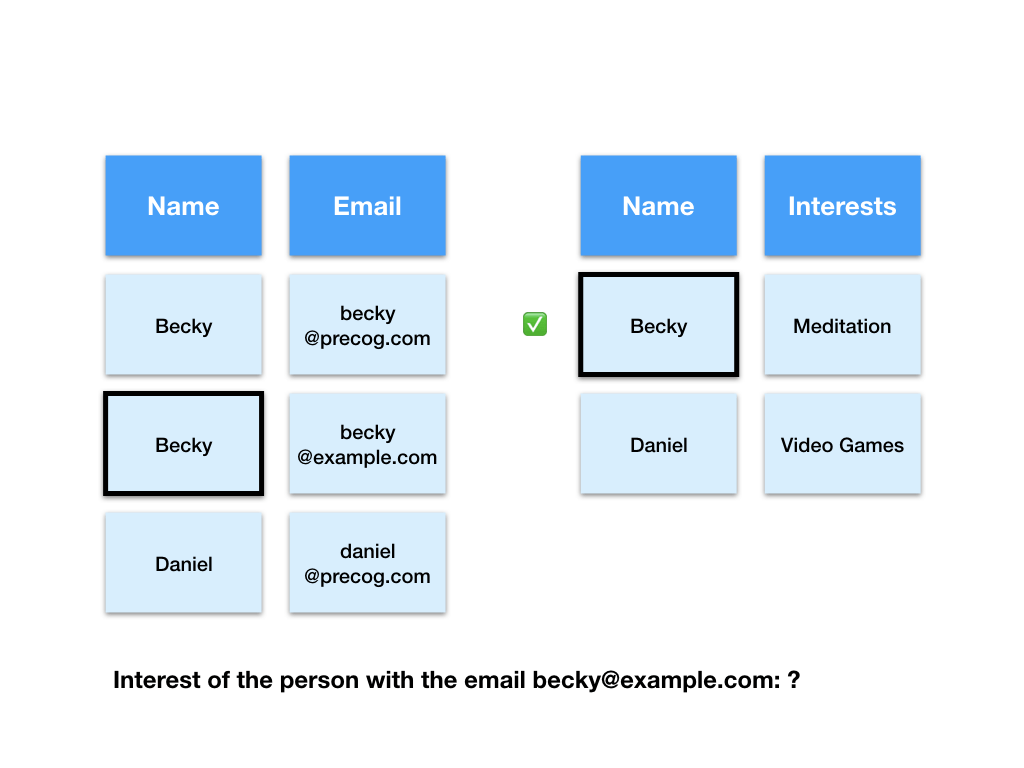
This process of bringing together data from different tables is called joining and on large amounts of data is slow. We can run a process in advance called “indexing” to speed up our queries but with Precog there is a faster and easier way.
Let’s check out the original data again and try a different representation.

Here is another way to tabulate this dataset.
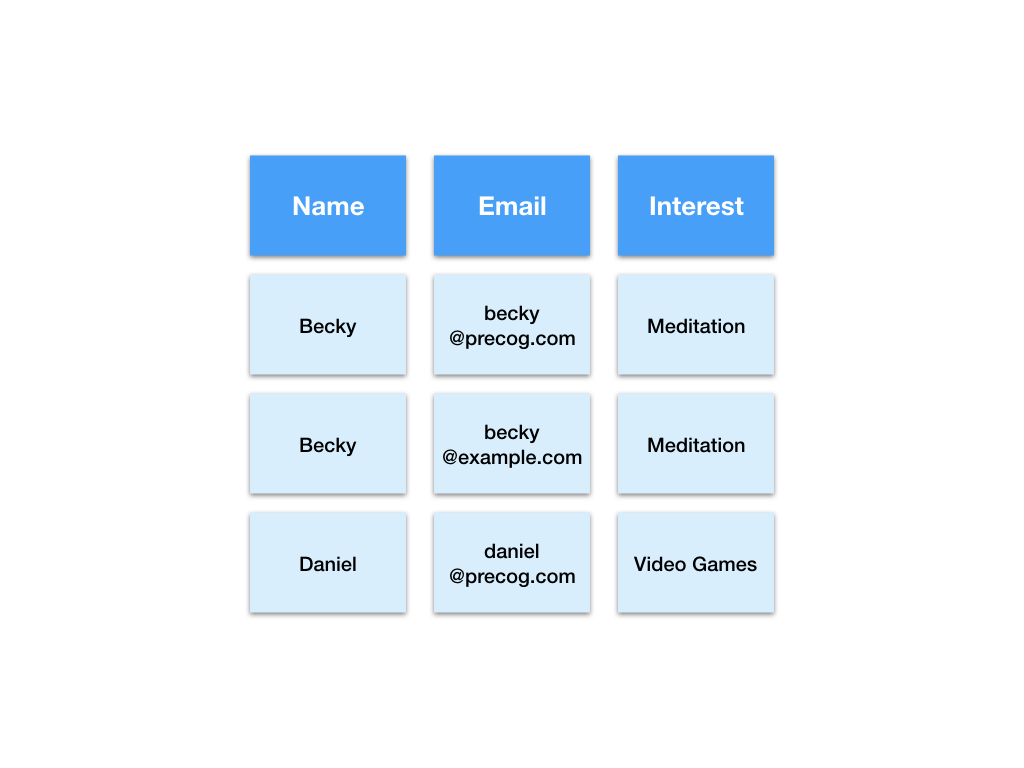
We call this representation of the data “Analytics ready”. Tabulating the data like this solves all the problems we’ve encountered.
We can easily count the number of emails.
We can easily look up information.
And our table, our analyses, our reports, our queries and our visualisations will all automatically stay up to date as new email addresses are added.
This makes our queries faster and reduces the amount of work needed to create and maintain tables, analyses, reports and visualisations.
You may have also noticed there are fewer empty (null) values than in the first representation.
Precog supports all of these approaches to loading nested data. It can even switch between them as needed within the same table.
Precog’s cutting edge technology is the world’s fastest at tabulating nested data and the straightforward user interface makes tabulation easy and accurate.
Precog has no size limits, supports all levels of nesting and can load data from both keys and values. These features empower you to quickly and easily load even the most complex data.