Analysing the tabulated data with Power BI
Now that the data has been tabulated, we can analyse it using software such as Microsoft Power BI.
PowerBI can either connect directly to Precog, or to a database or warehouse such as Snowflake or Postgres where Precog has pushed the data.
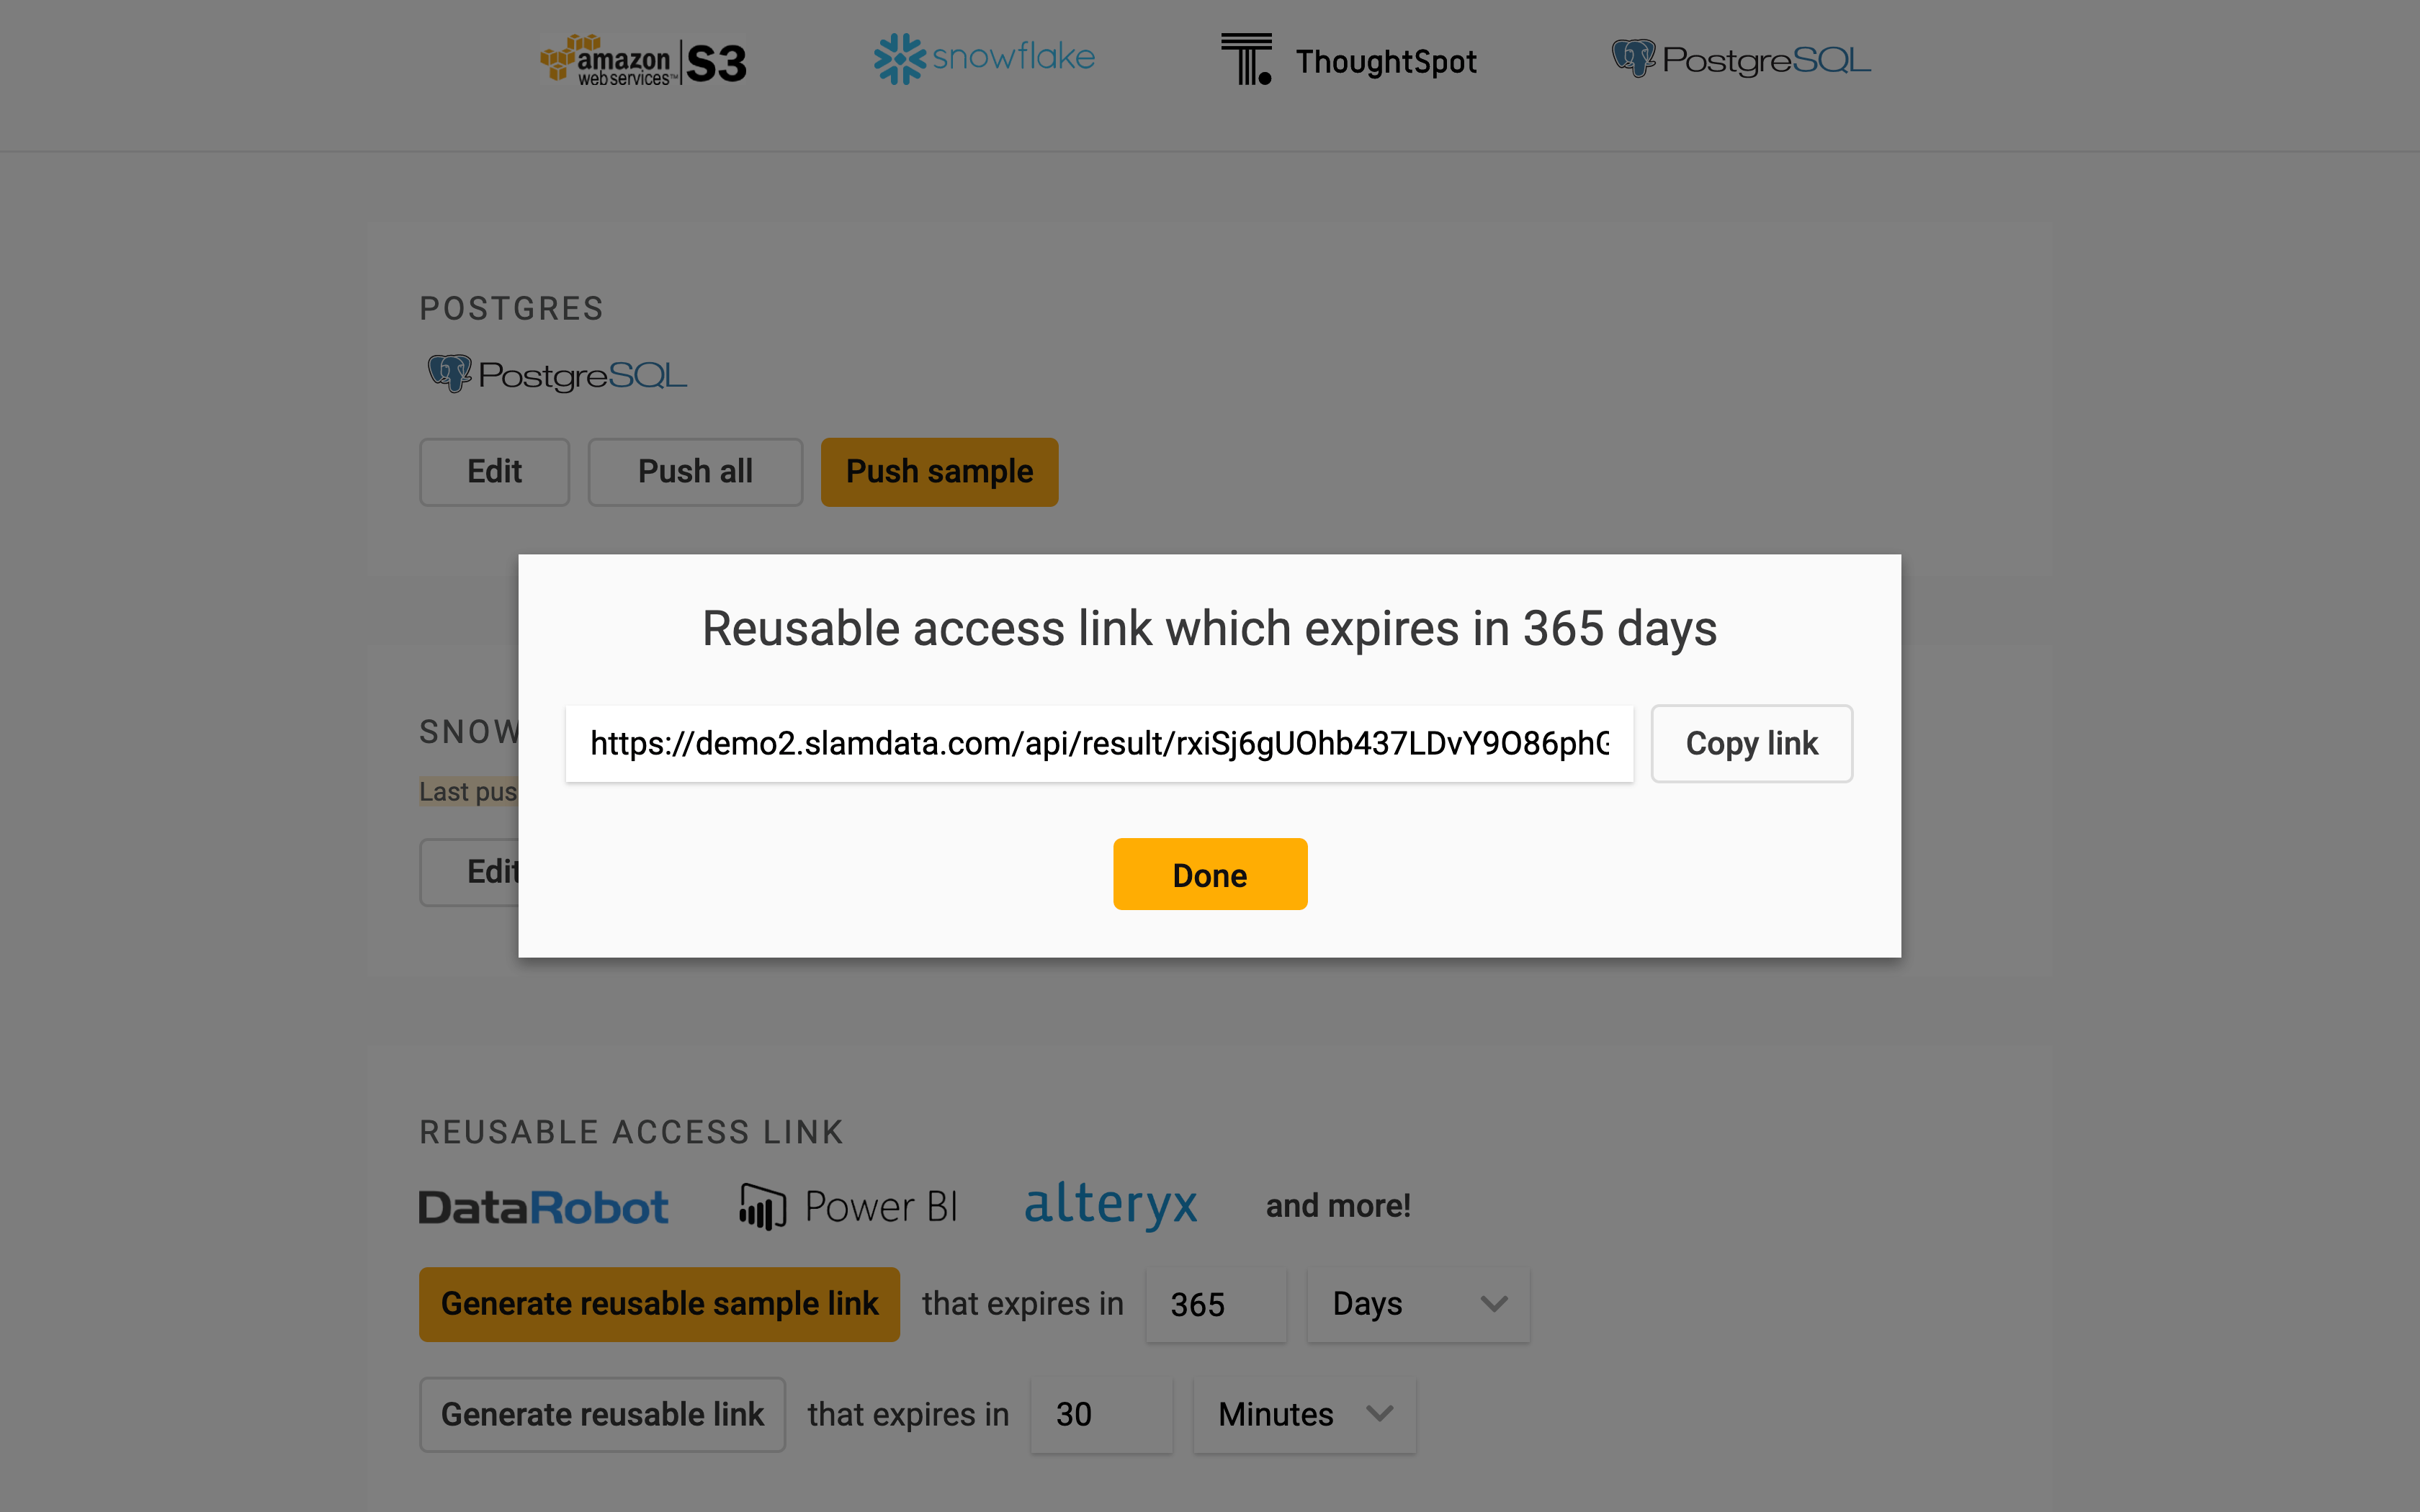
To connect Power BI directly to Precog, go to the results page for the ADVERSE_DRUG_REACTIONS table in Precog, then create and copy a reusable access link.
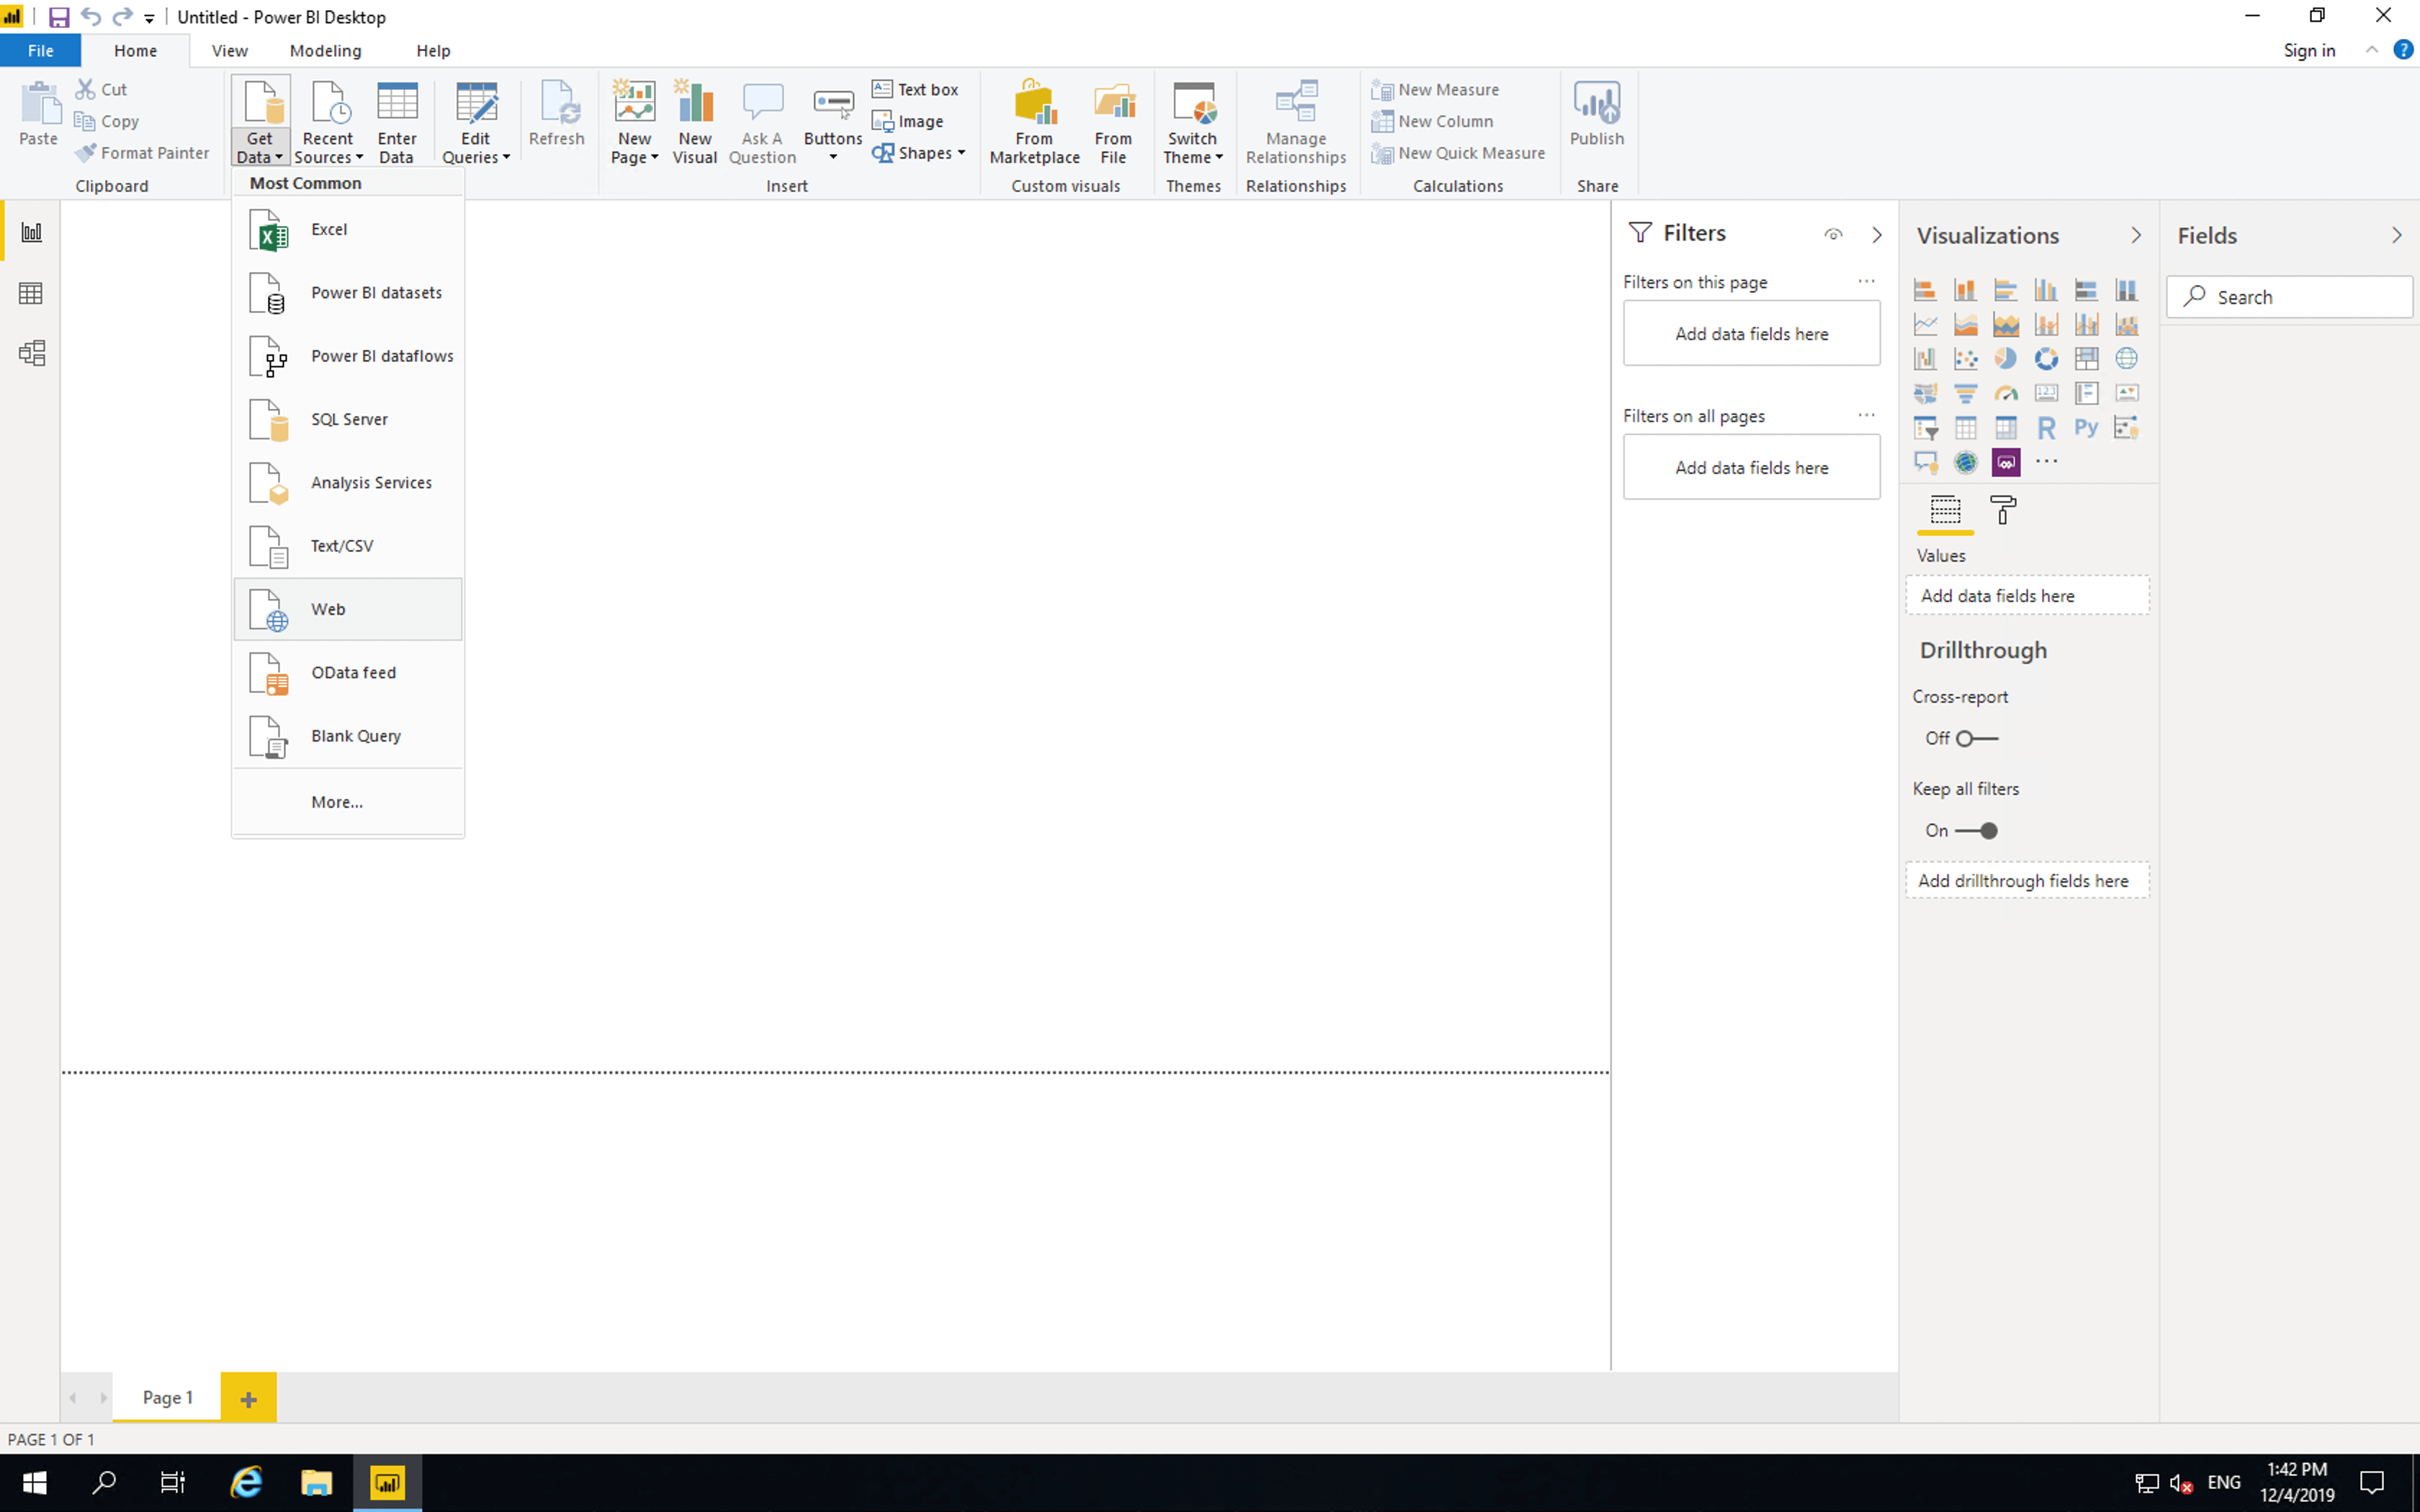
Next open Power BI, click “Get Data” then click “Web”.
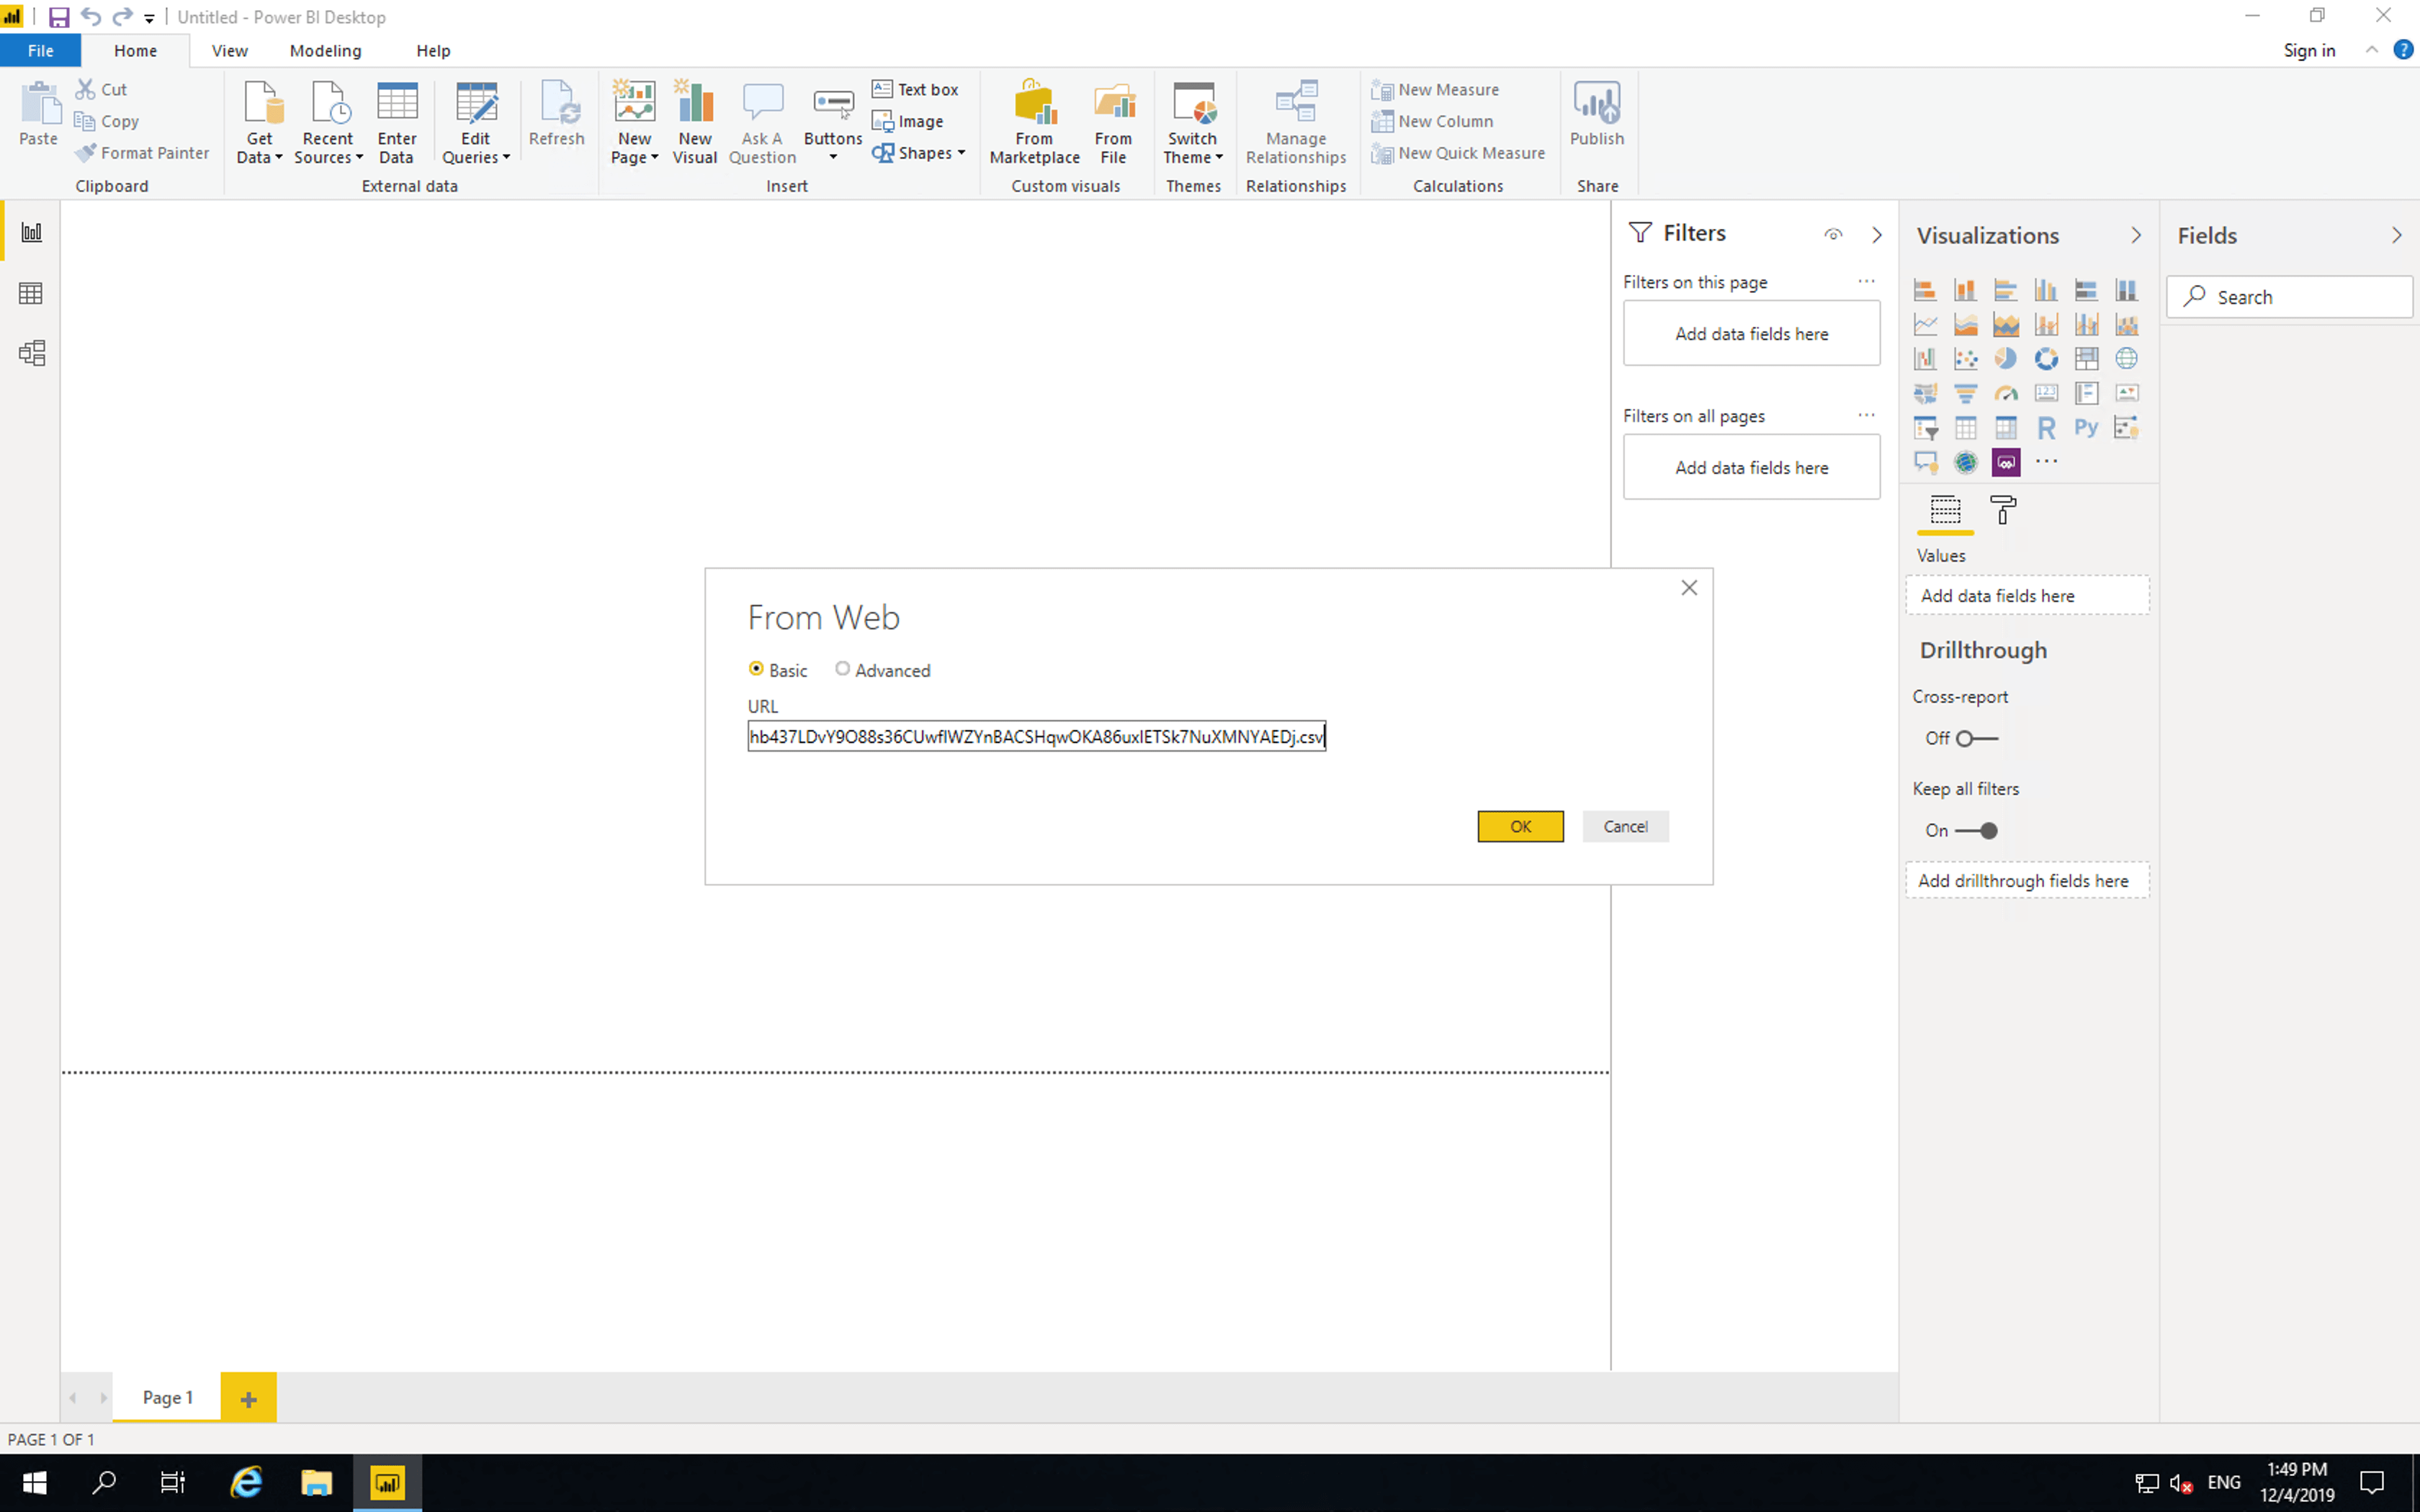
Then paste the access link and click “OK”.
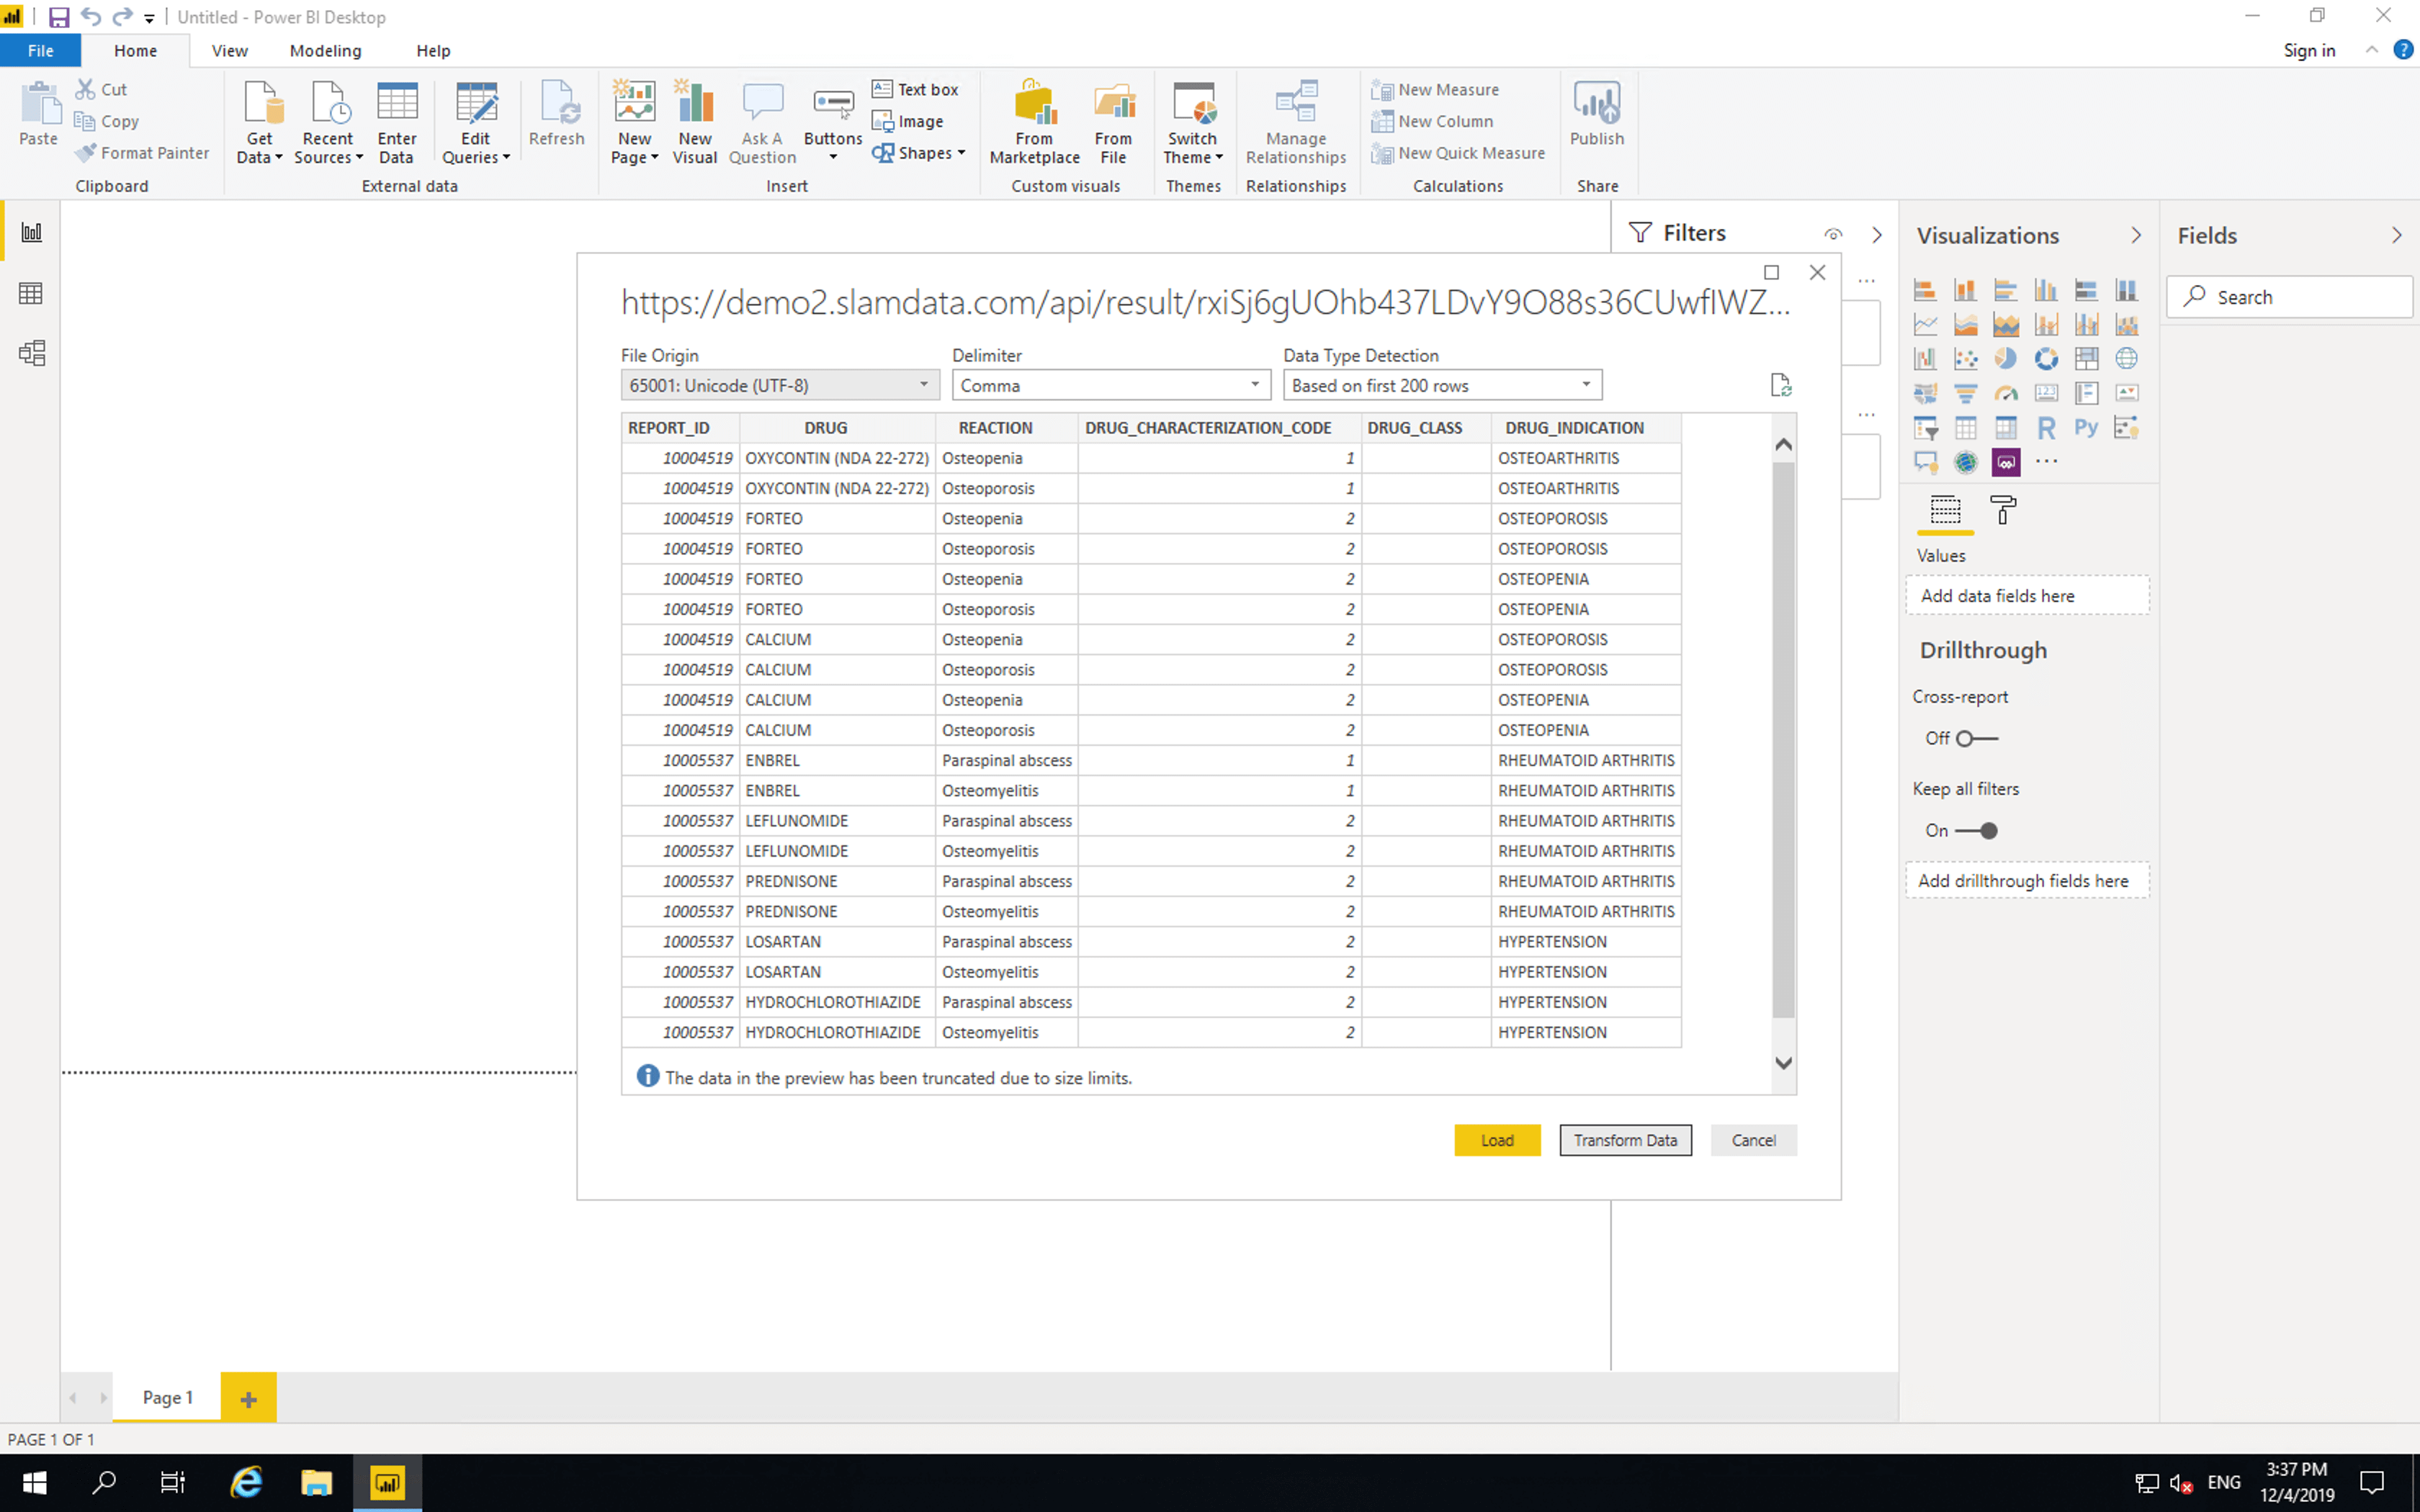
Precog pages and tabulates the data from the OpenFDA API and provides the latest results to Power BI.
Click “Transform Data”.
In the “Query Settings” section, set “Name” to “DRUG_REACTIONS”. Remove “Changed Type” from the “APPLIED STEPS”. Then click “Close & Apply”.
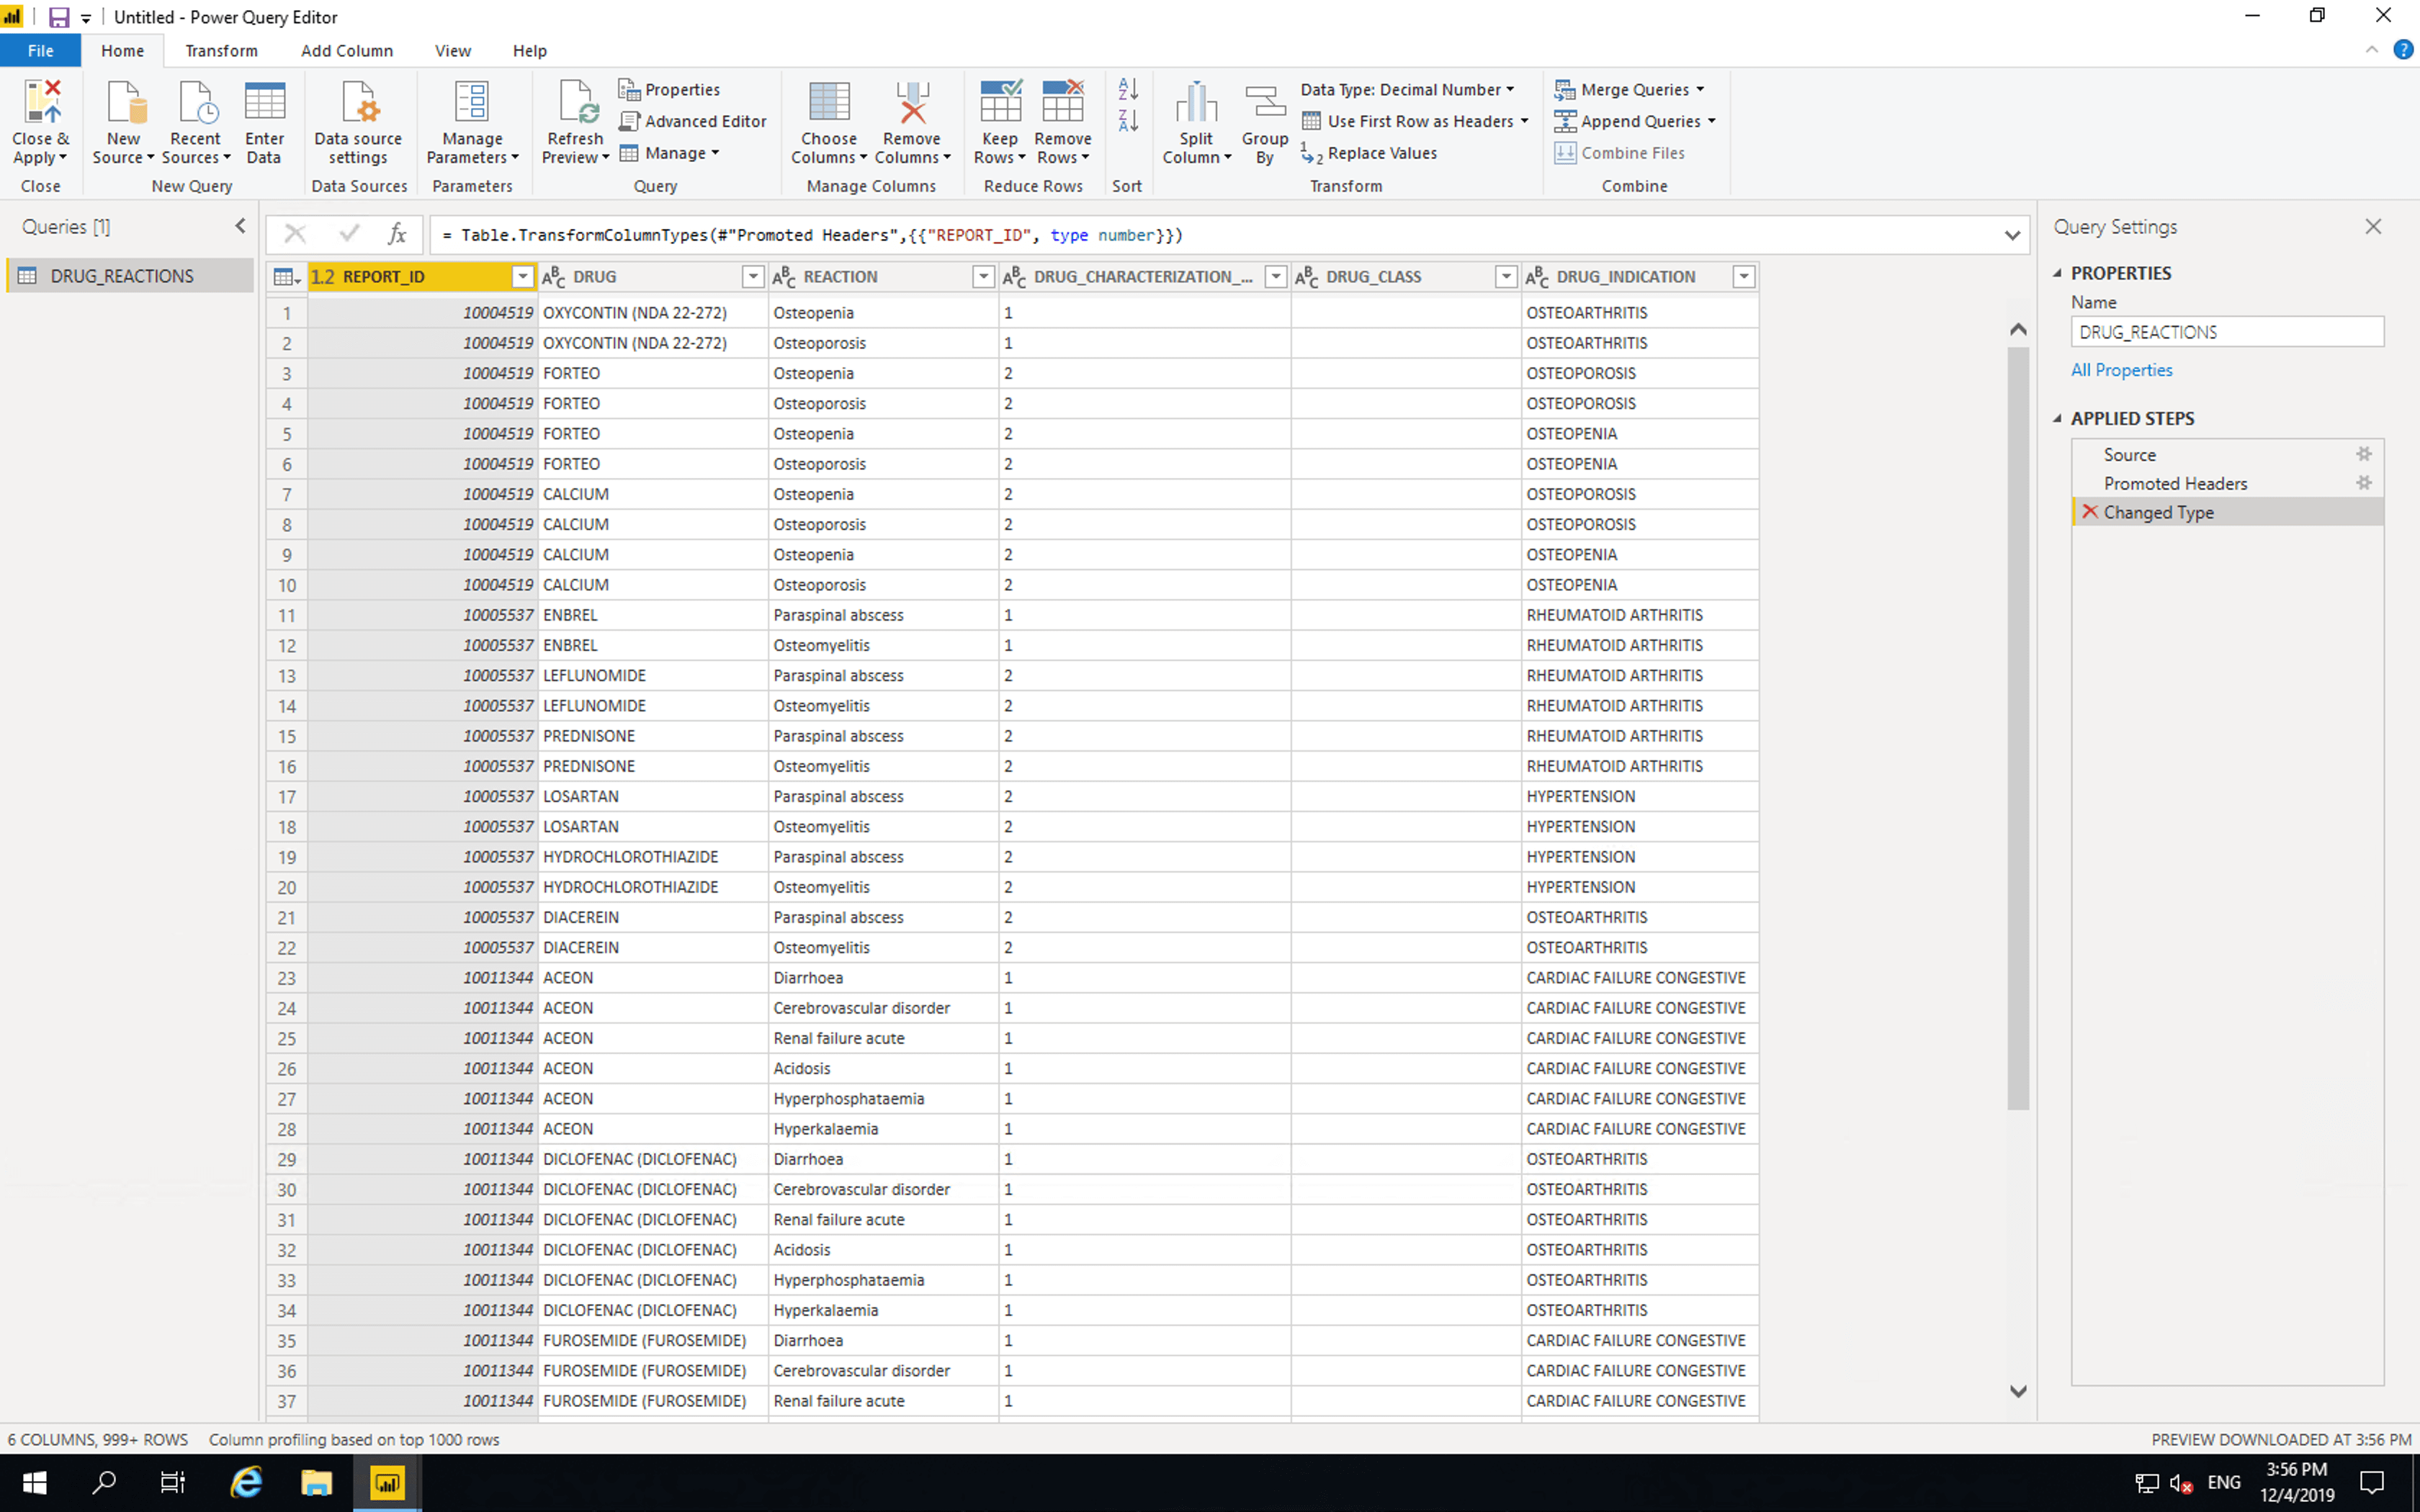
The data is now available in PowerBI for analysis and visualisation.
The FDA states that
When a report lists multiple drugs and multiple reactions, there is no way to conclude from the data therein that a given drug is responsible for a given reaction.
As such let’s add a column which denotes whether each reaction is conclusive or not.
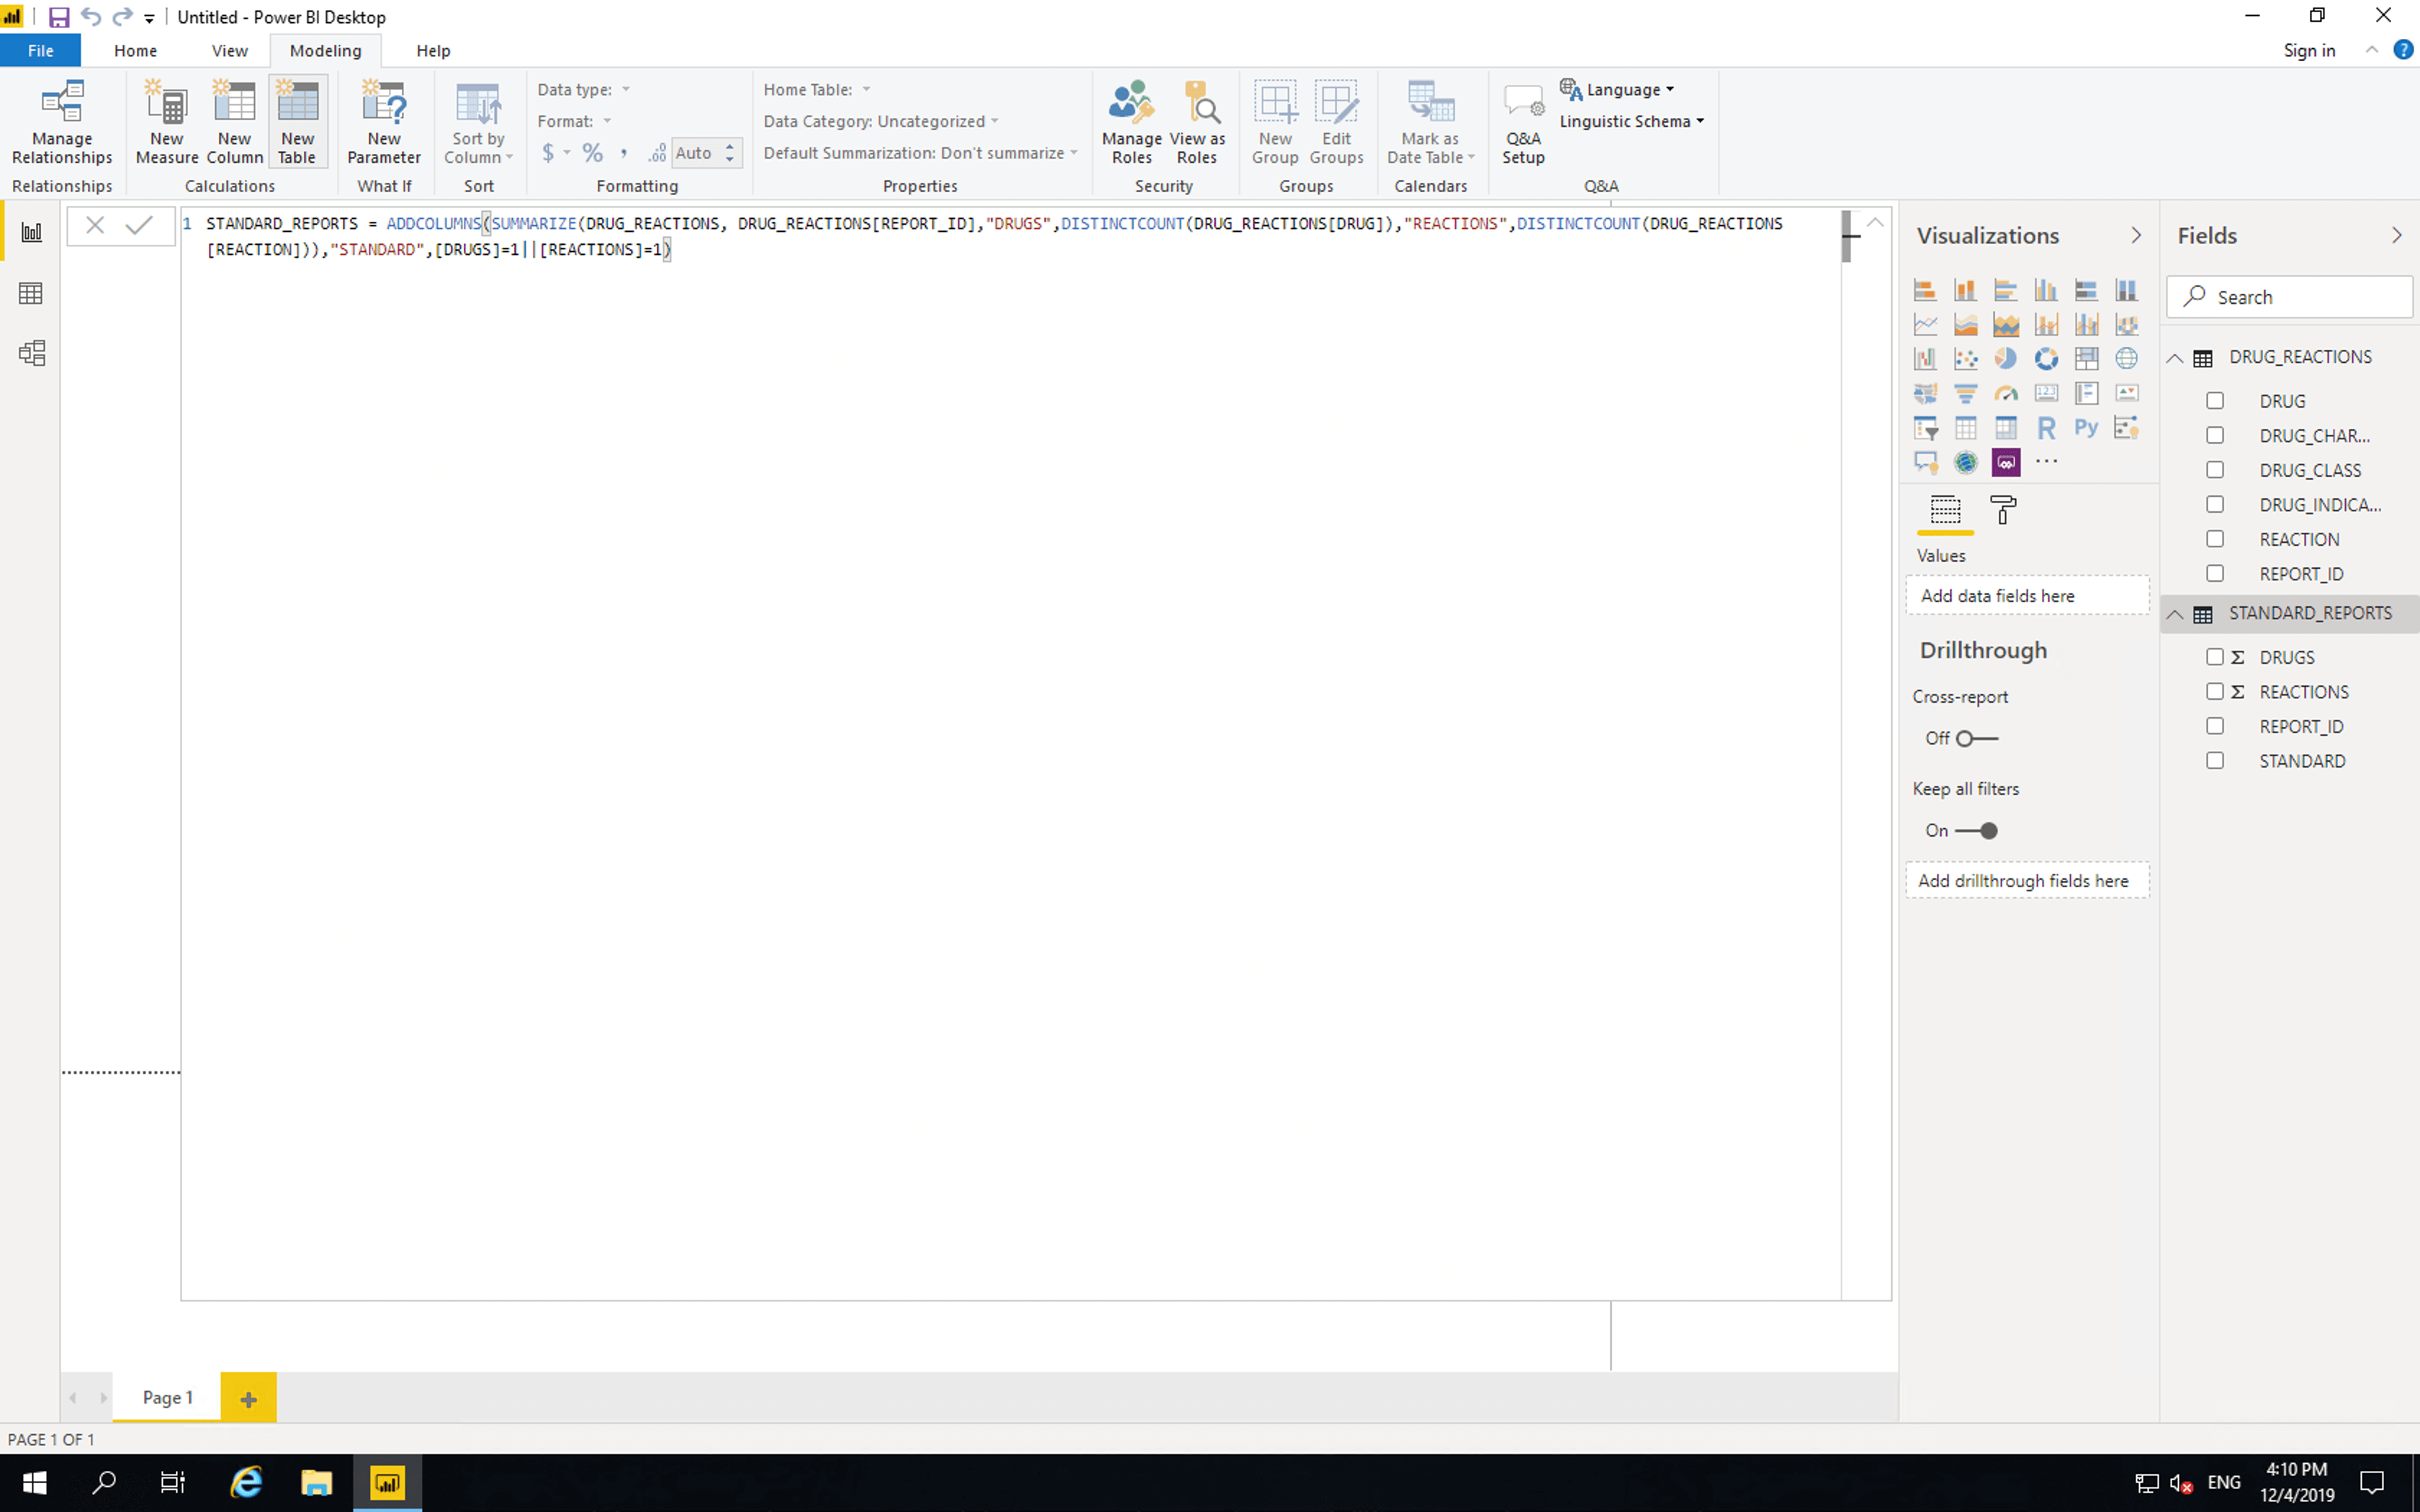
Click “Modeling”, click “Add Table”, then paste the following
STANDARD_REPORTS = ADDCOLUMNS(SUMMARIZE(DRUG_REACTIONS, DRUG_REACTIONS[REPORT_ID],"DRUGS",DISTINCTCOUNT(DRUG_REACTIONS[DRUG]),"REACTIONS",DISTINCTCOUNT(DRUG_REACTIONS[REACTION])),"STANDARD",[DRUGS]=1||[REACTIONS]=1)
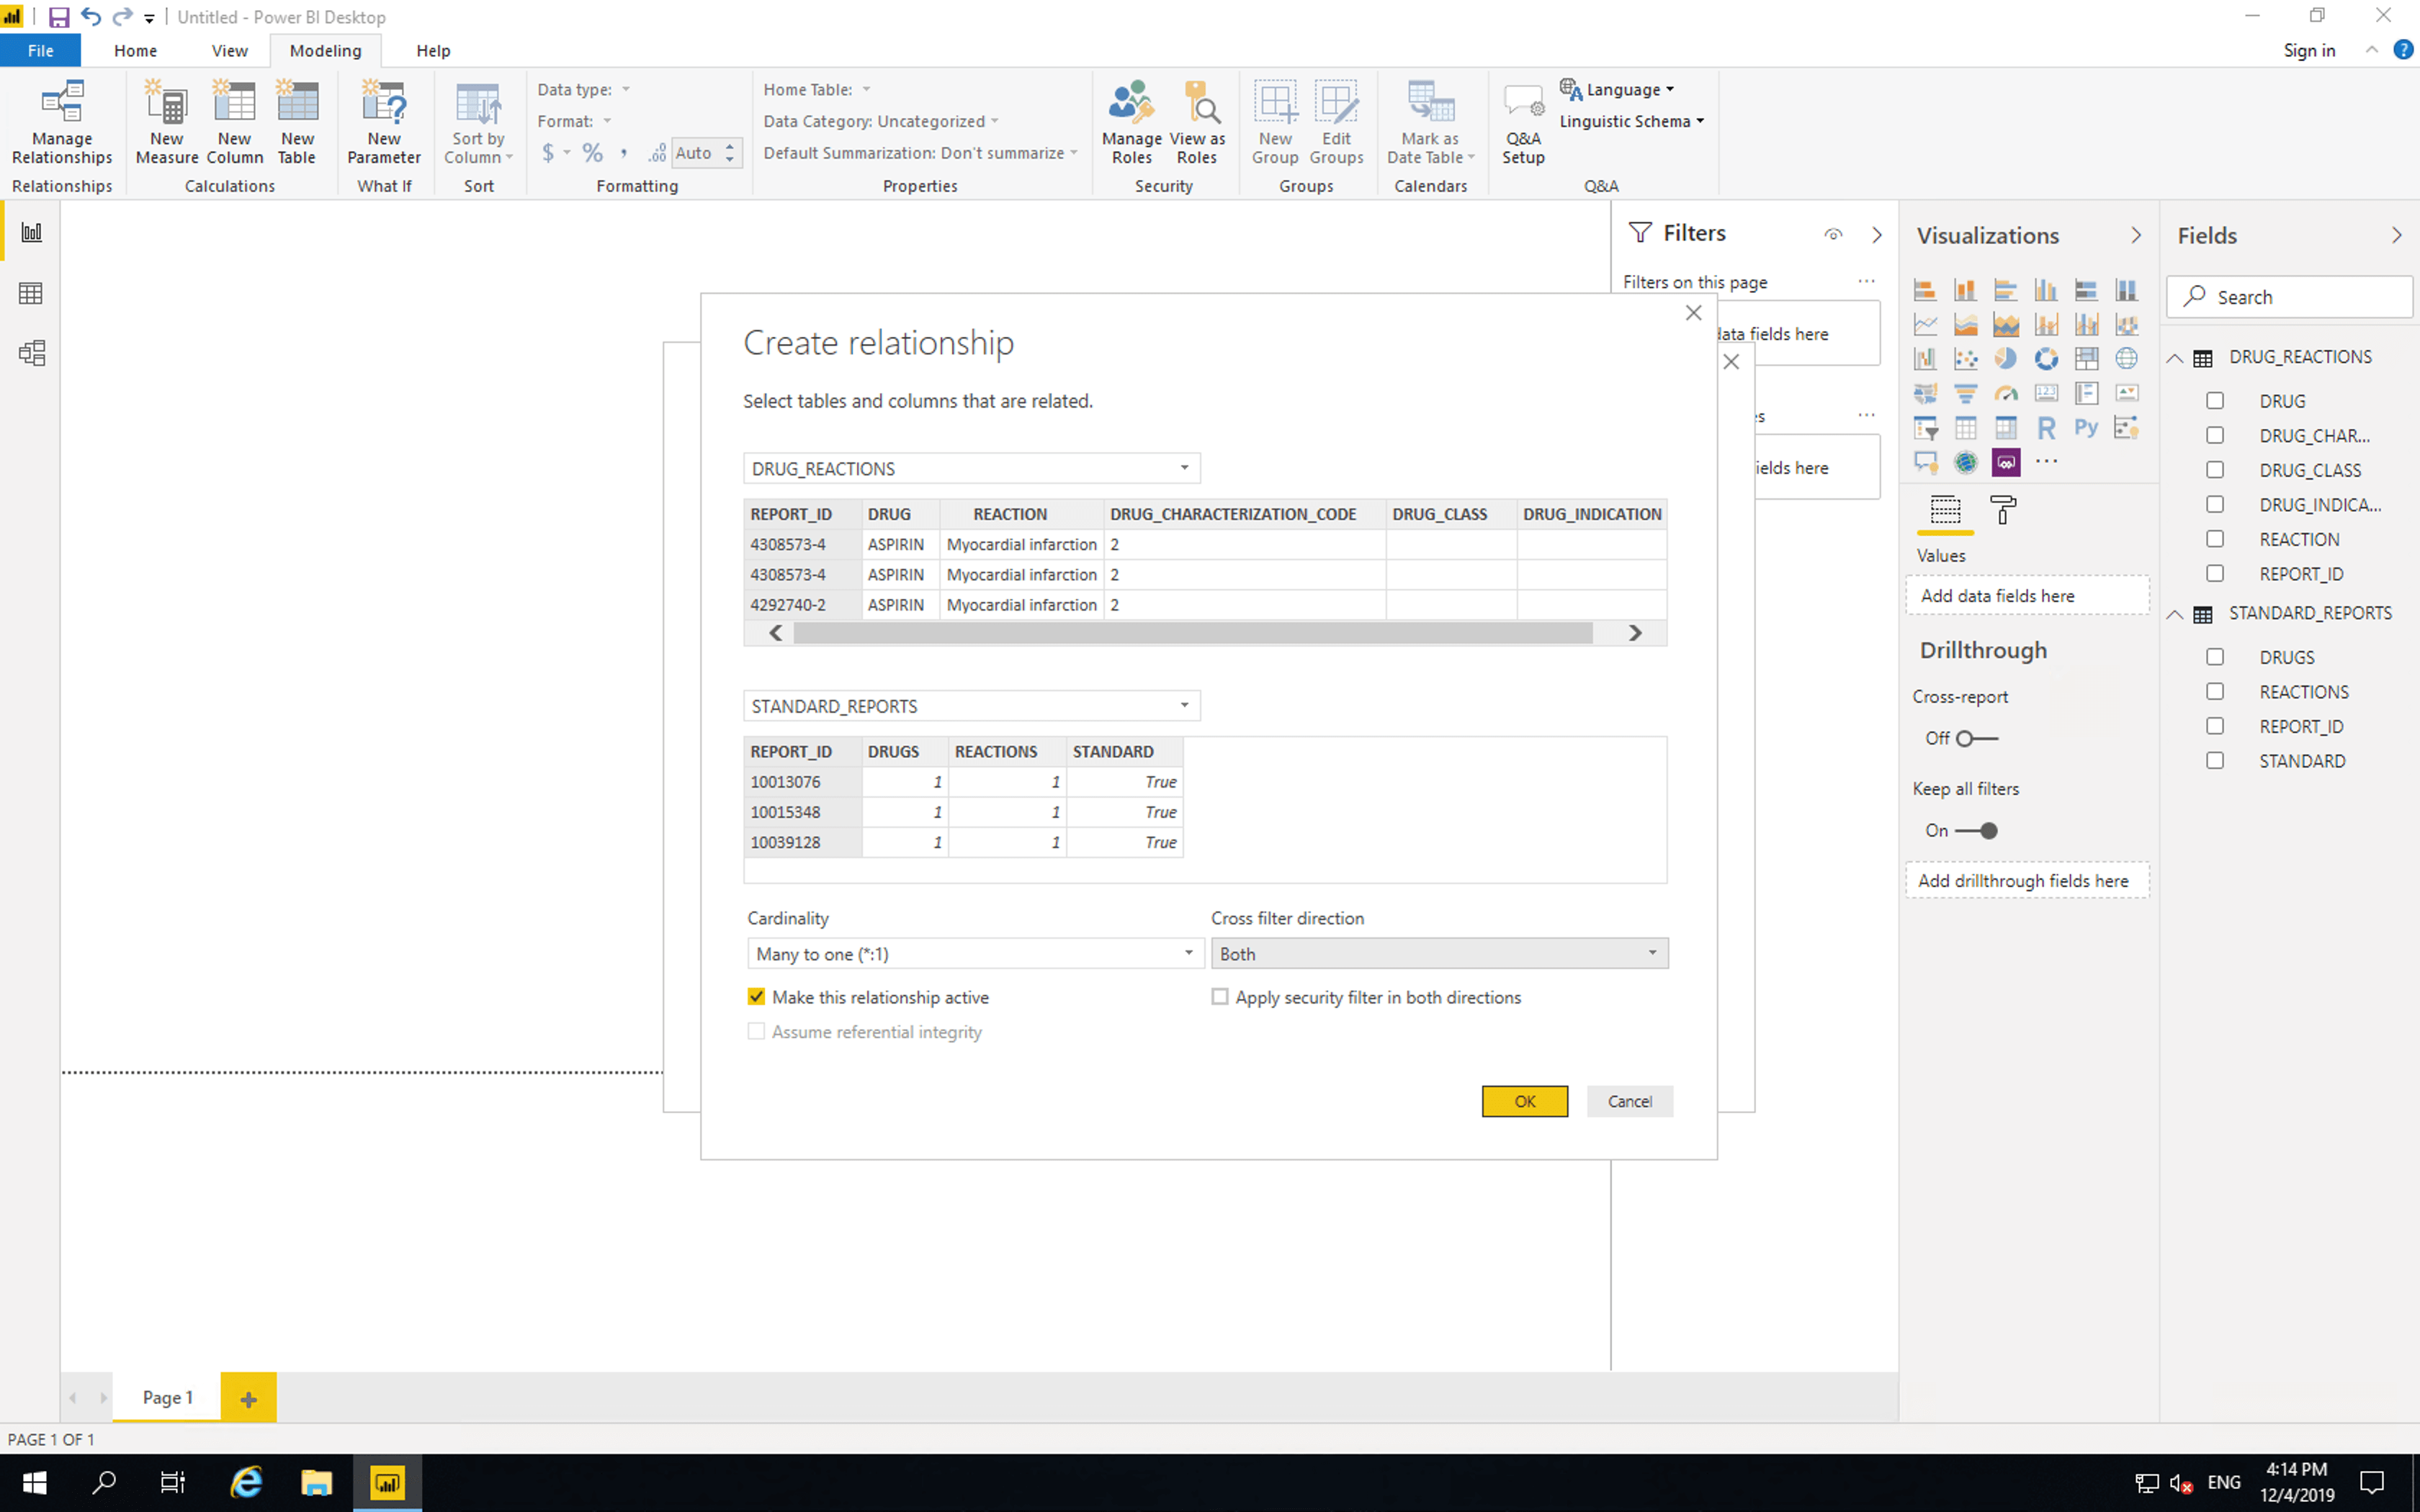
Then click “Manage relationships”, click “New”, select “DRUG_REACTIONS”, set “Cross filter direction” to “Both”, click “OK” then click “Close”.
Next insert a “Donut chart”. Drag CONCLUSIVE from CONCLUSIVE_REPORTS to “Legend” and drag REPORT_ID from CONCLUSIVE_REPORTS to “Values”.
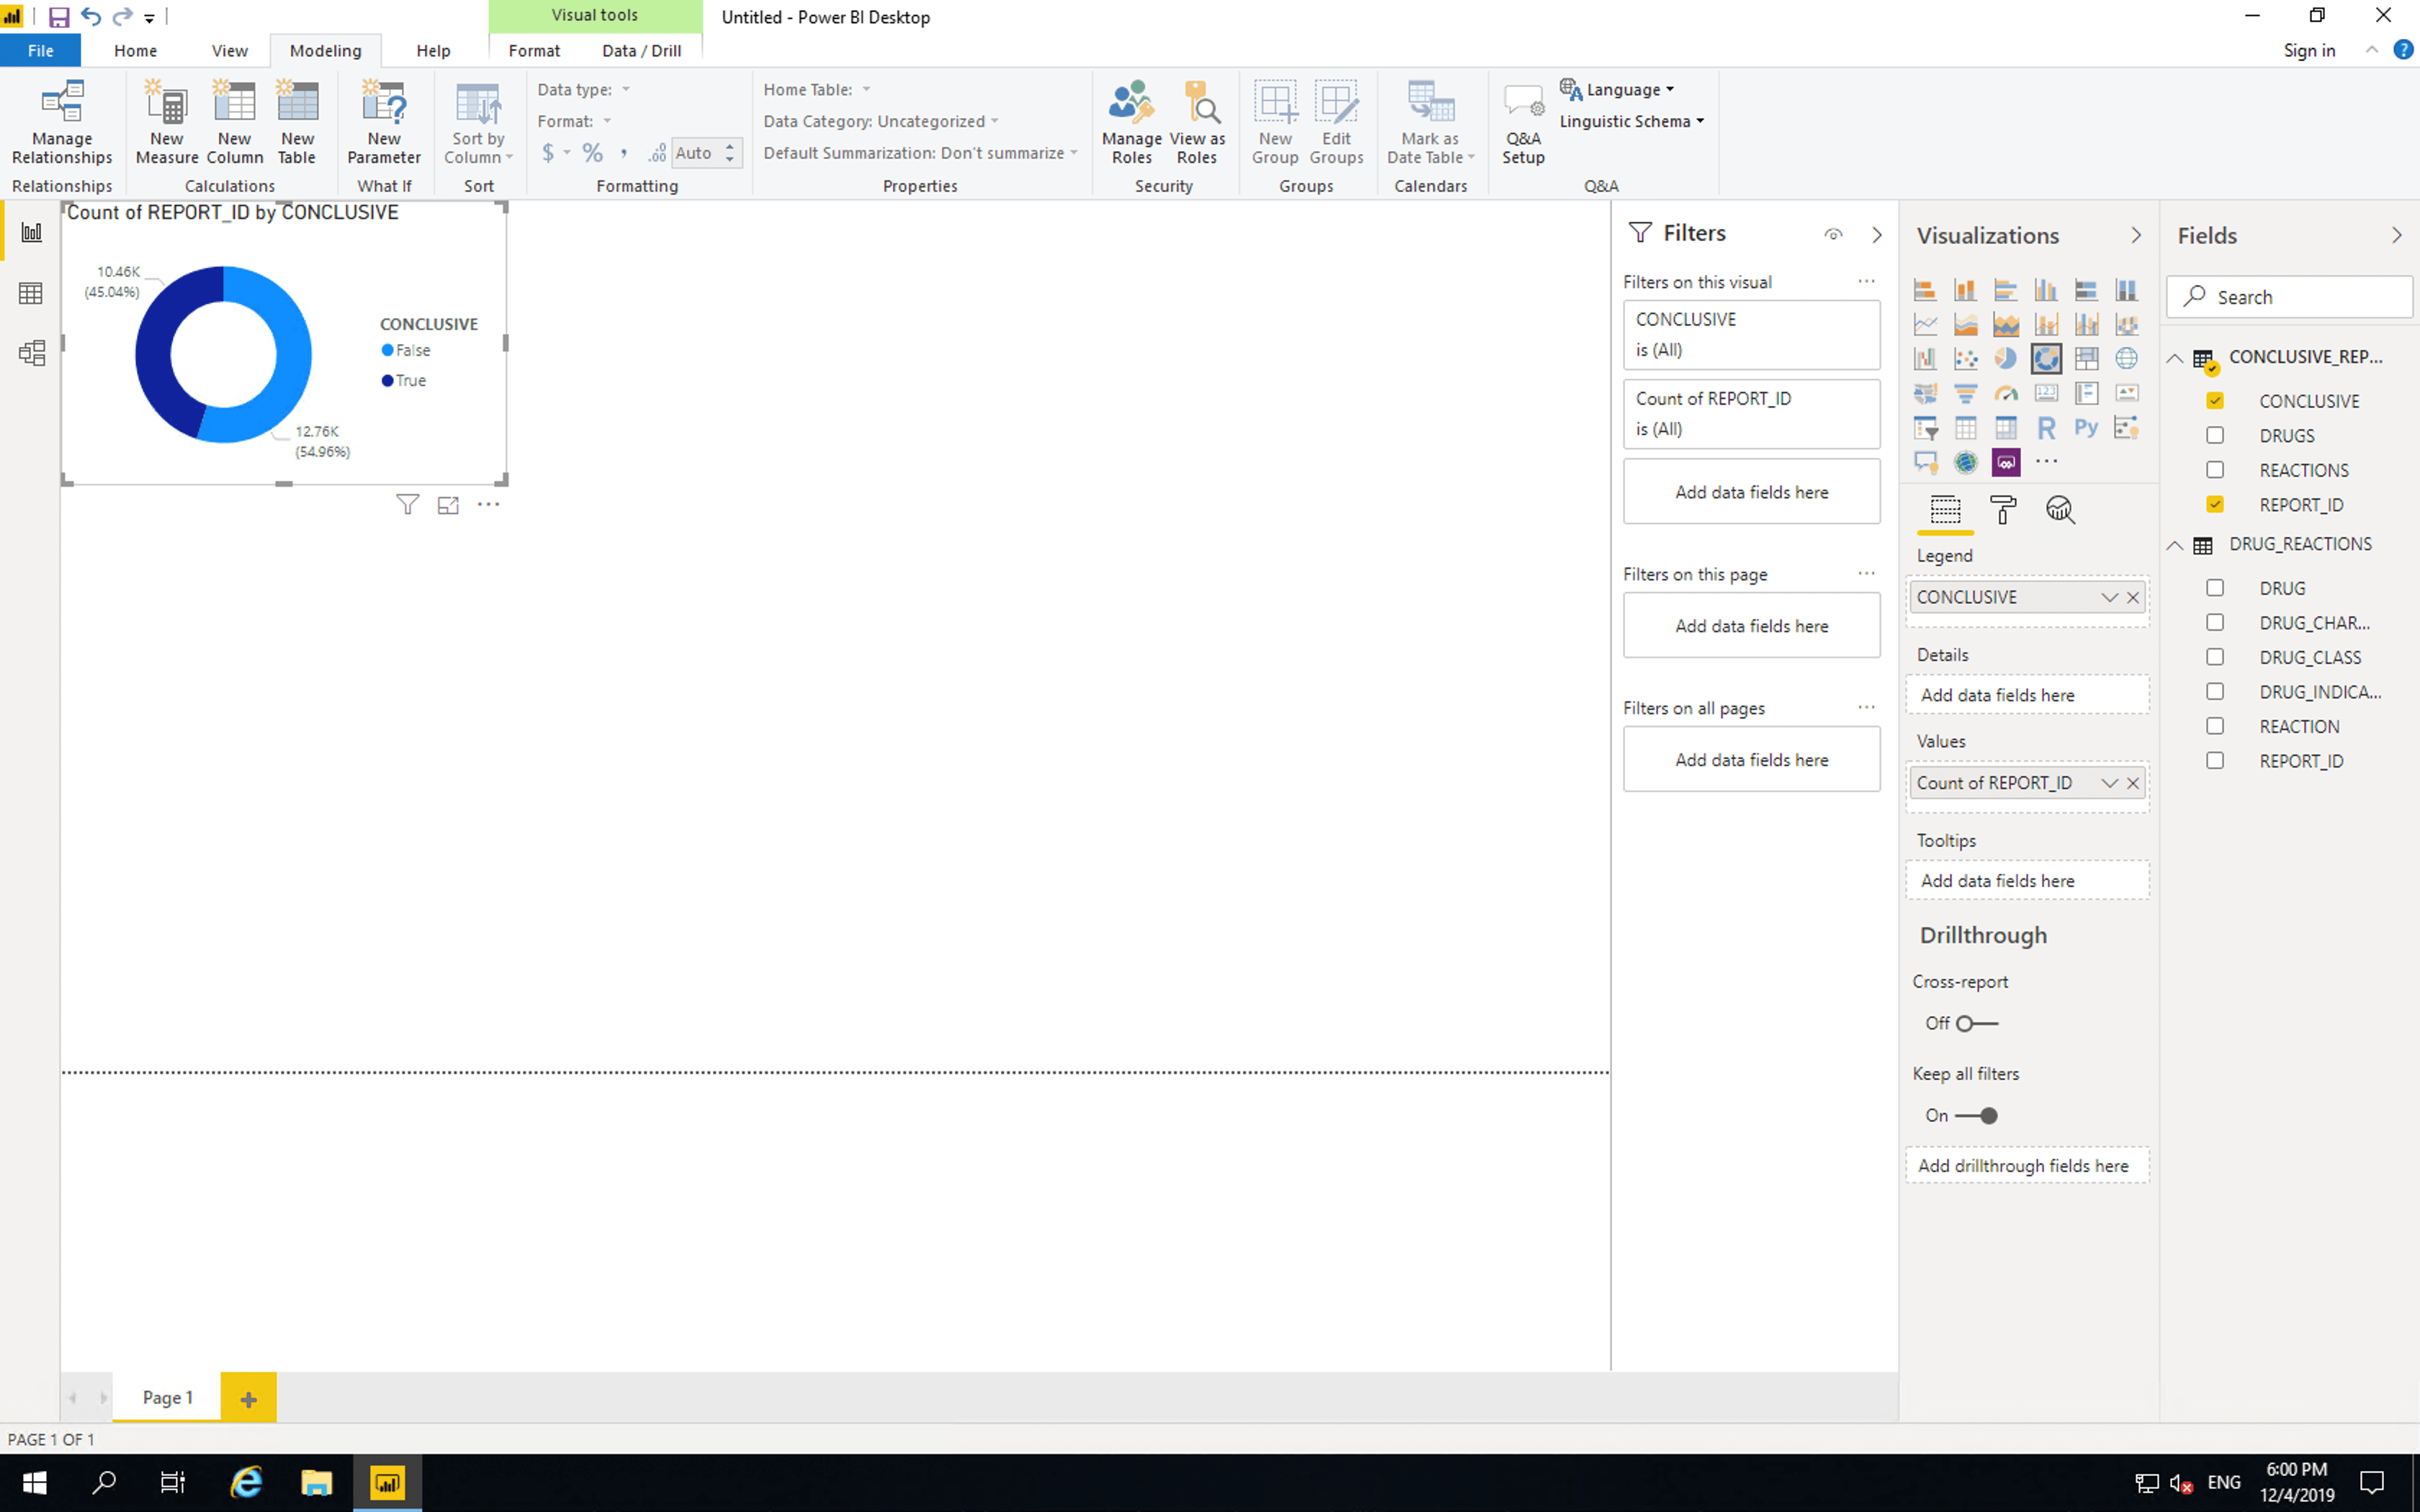
As shown here, the majority of reports are not conclusive. If reporting was changed such that reactions were listed per drug, then all new reports would be. Of course such a change is quite a large endeavour.
The FDA provides access to the following chart, but the usefulness of this is limited. It includes non-conclusive reports, drugs which weren’t indicated for osteoarthritis and drugs which weren’t suspected to have caused the reported adverse reactions.
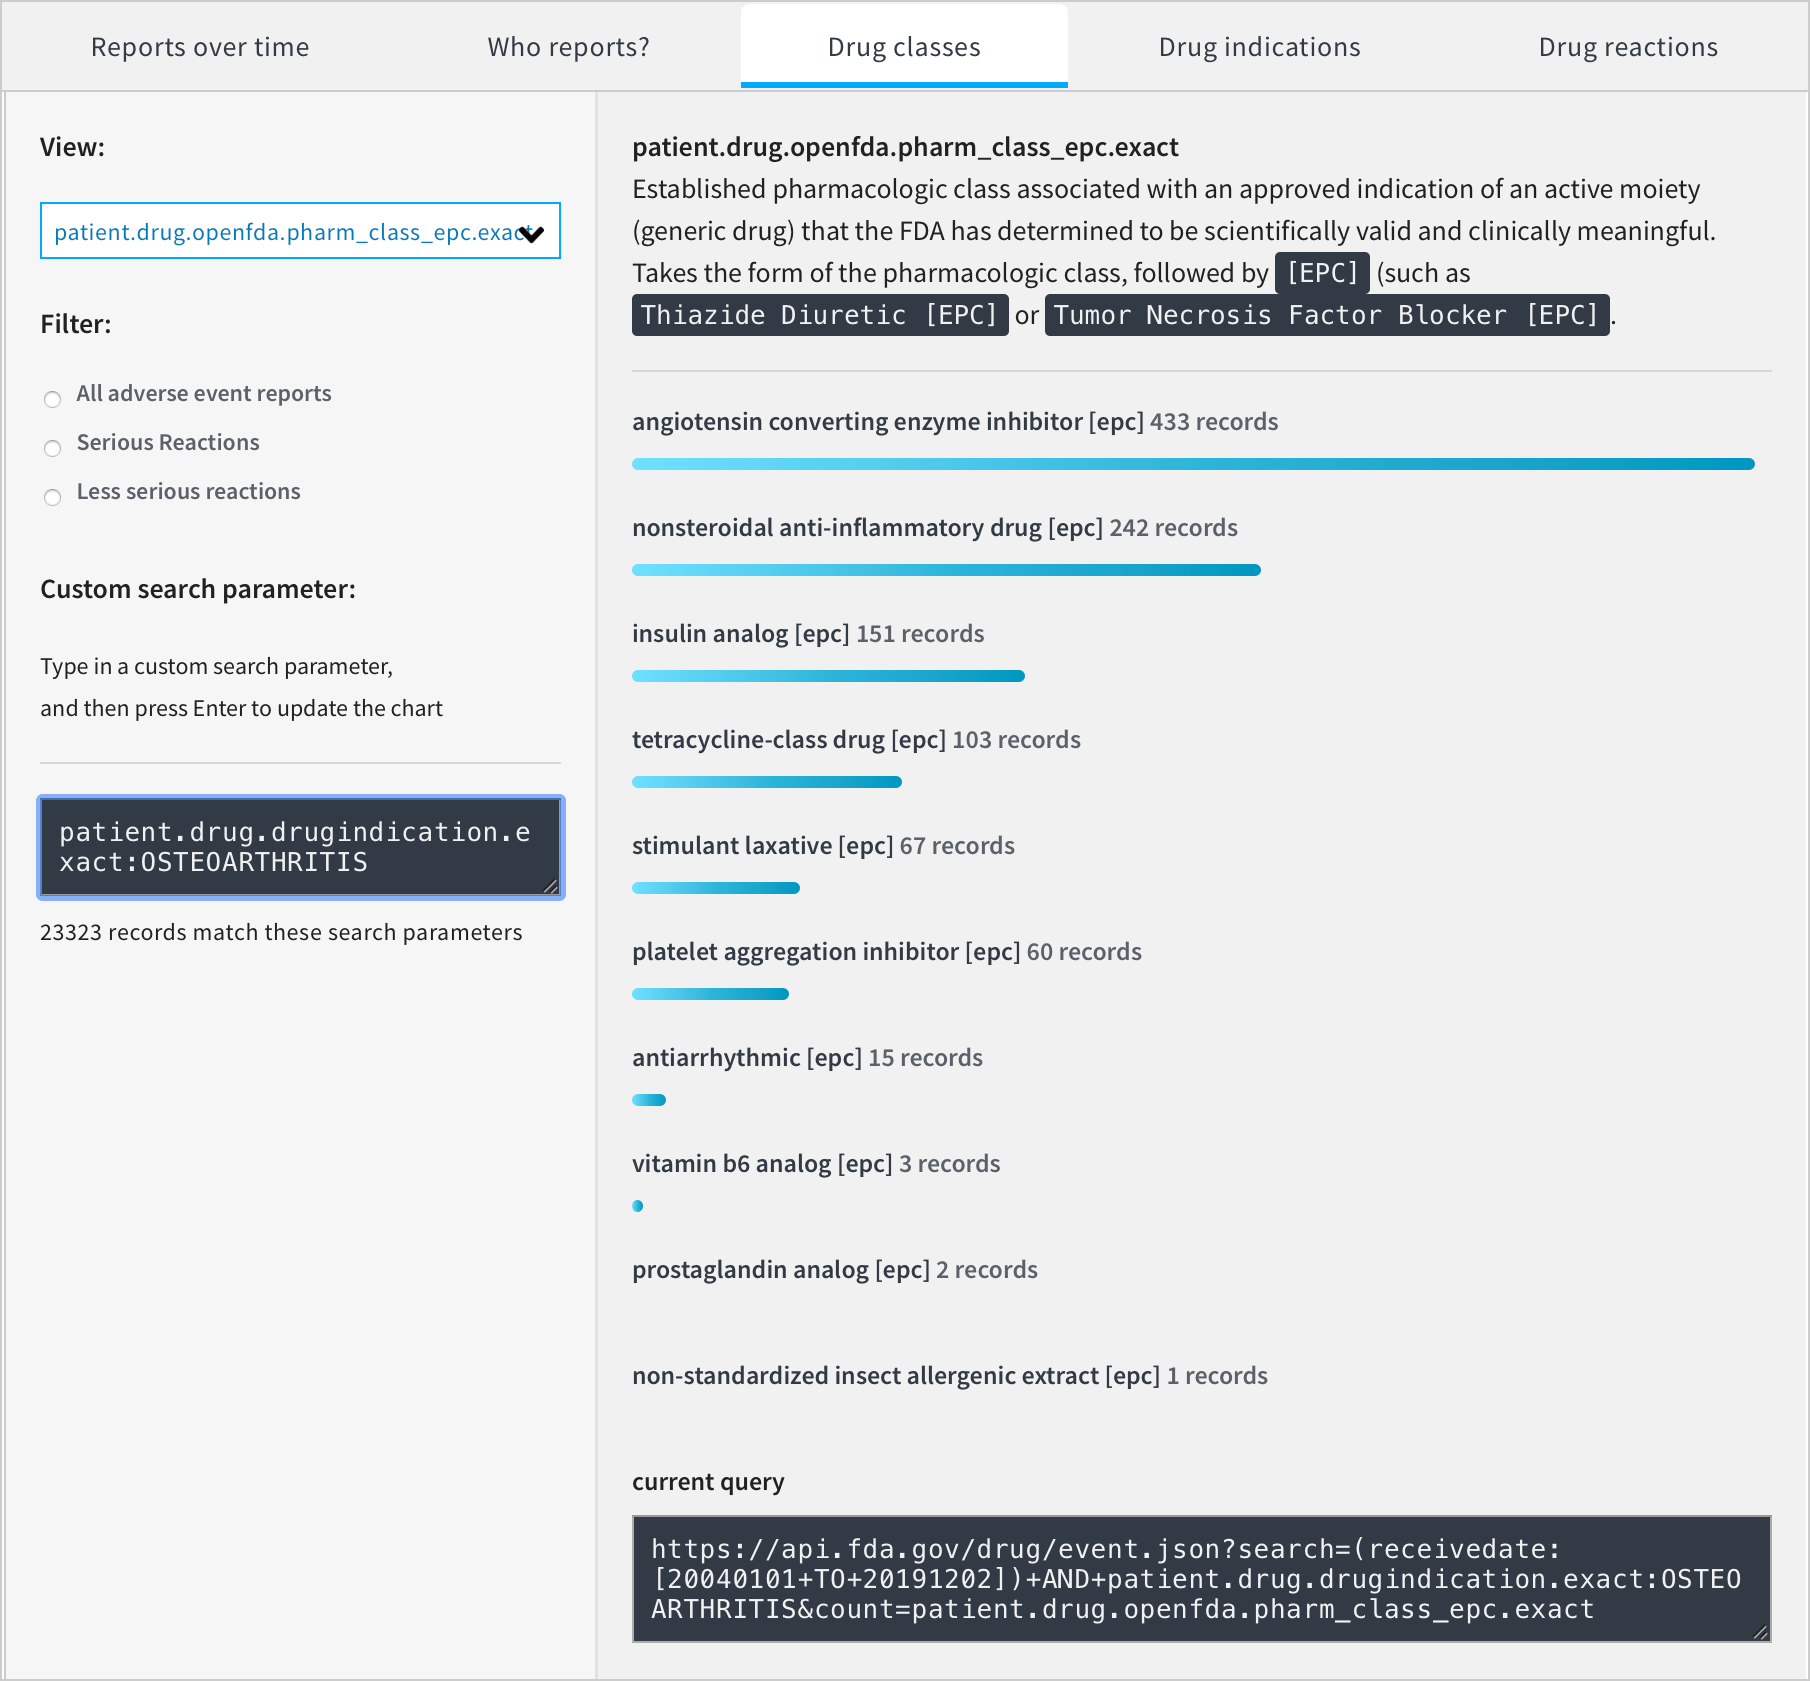
We can produce our own chart without these limitations.
Insert a “Stacked bar chart”, drag DRUG_CLASS to “Axis” and drag REPORT_ID from CONCLUSIVE_REPORTS to values.
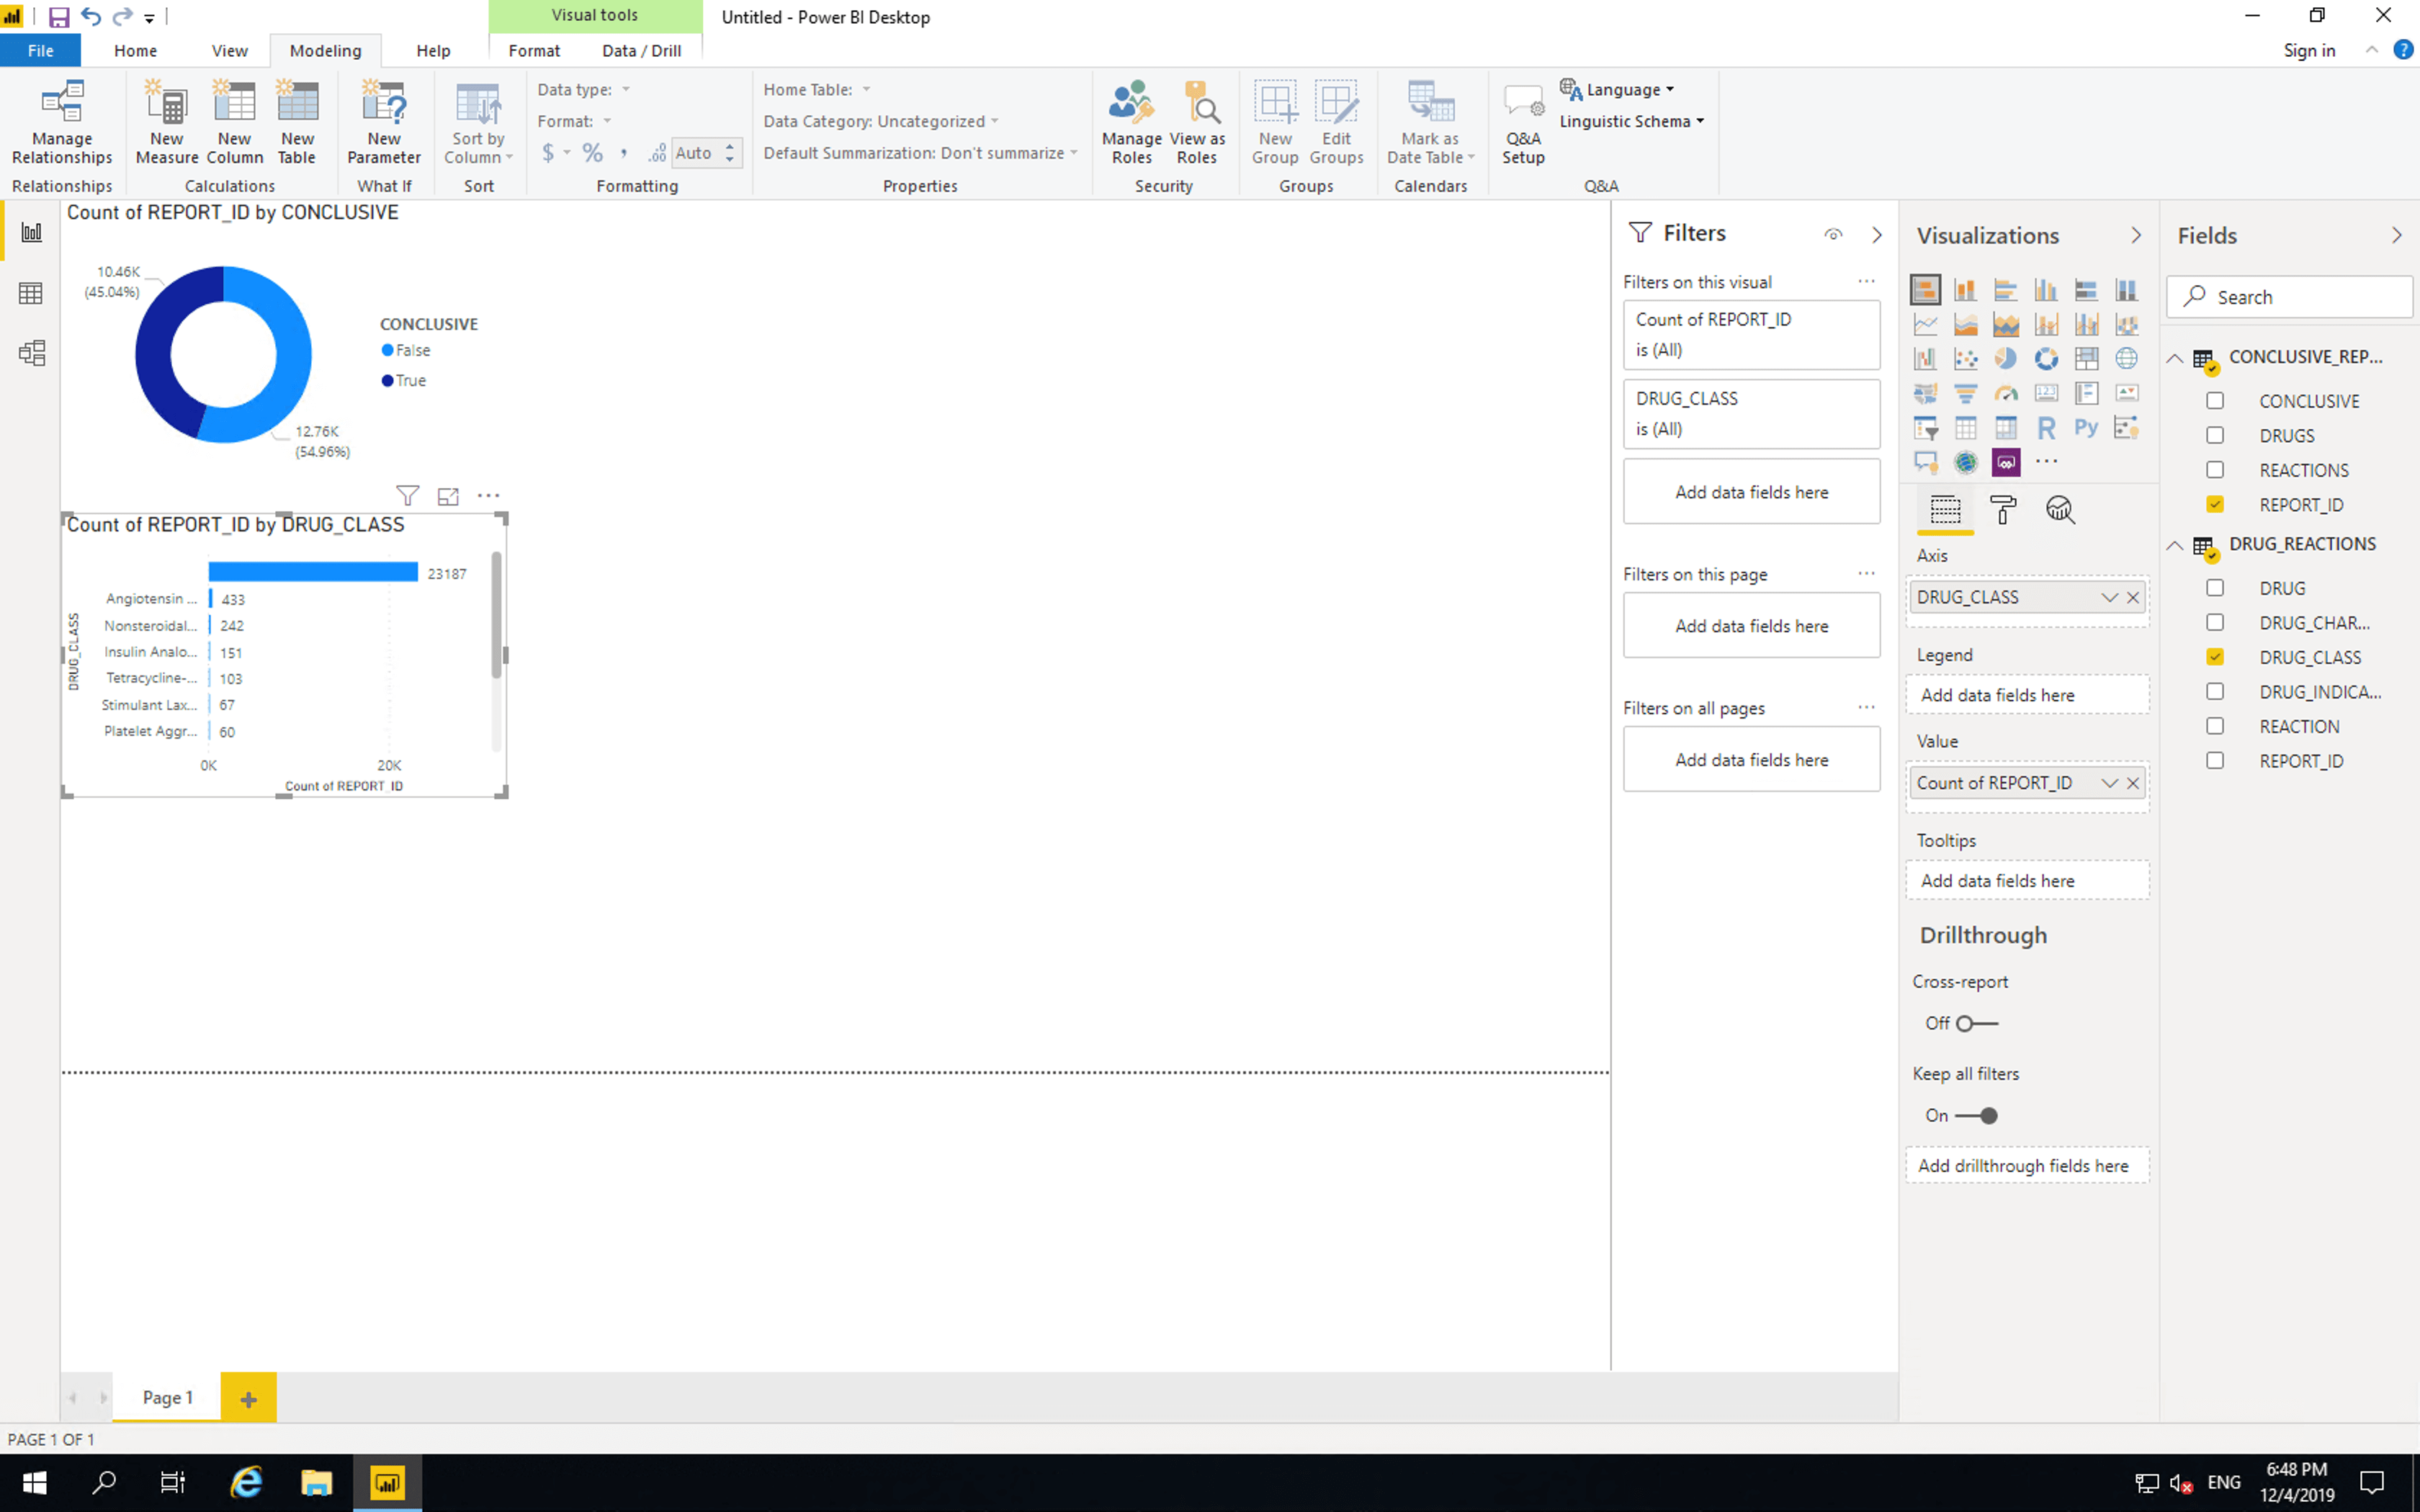
Currently this bar chart is the same as the one provided by the FDA with one key difference. Our chart shows that the vast majority of records don’t contain drug class information. As such we’ll need to drill down into the individual drugs themselves. Before we do this, we will remove the limitations of the FDA chart.
Drag CONCLUSIVE, DRUG_INDICATION and CHARACTERIZATION to “Filters on this vidual”. Select conclusive as “True”, drug indication as “Osteoarthritis” and characterization as “1” (this means the drug was suspected as the cause of the reaction).
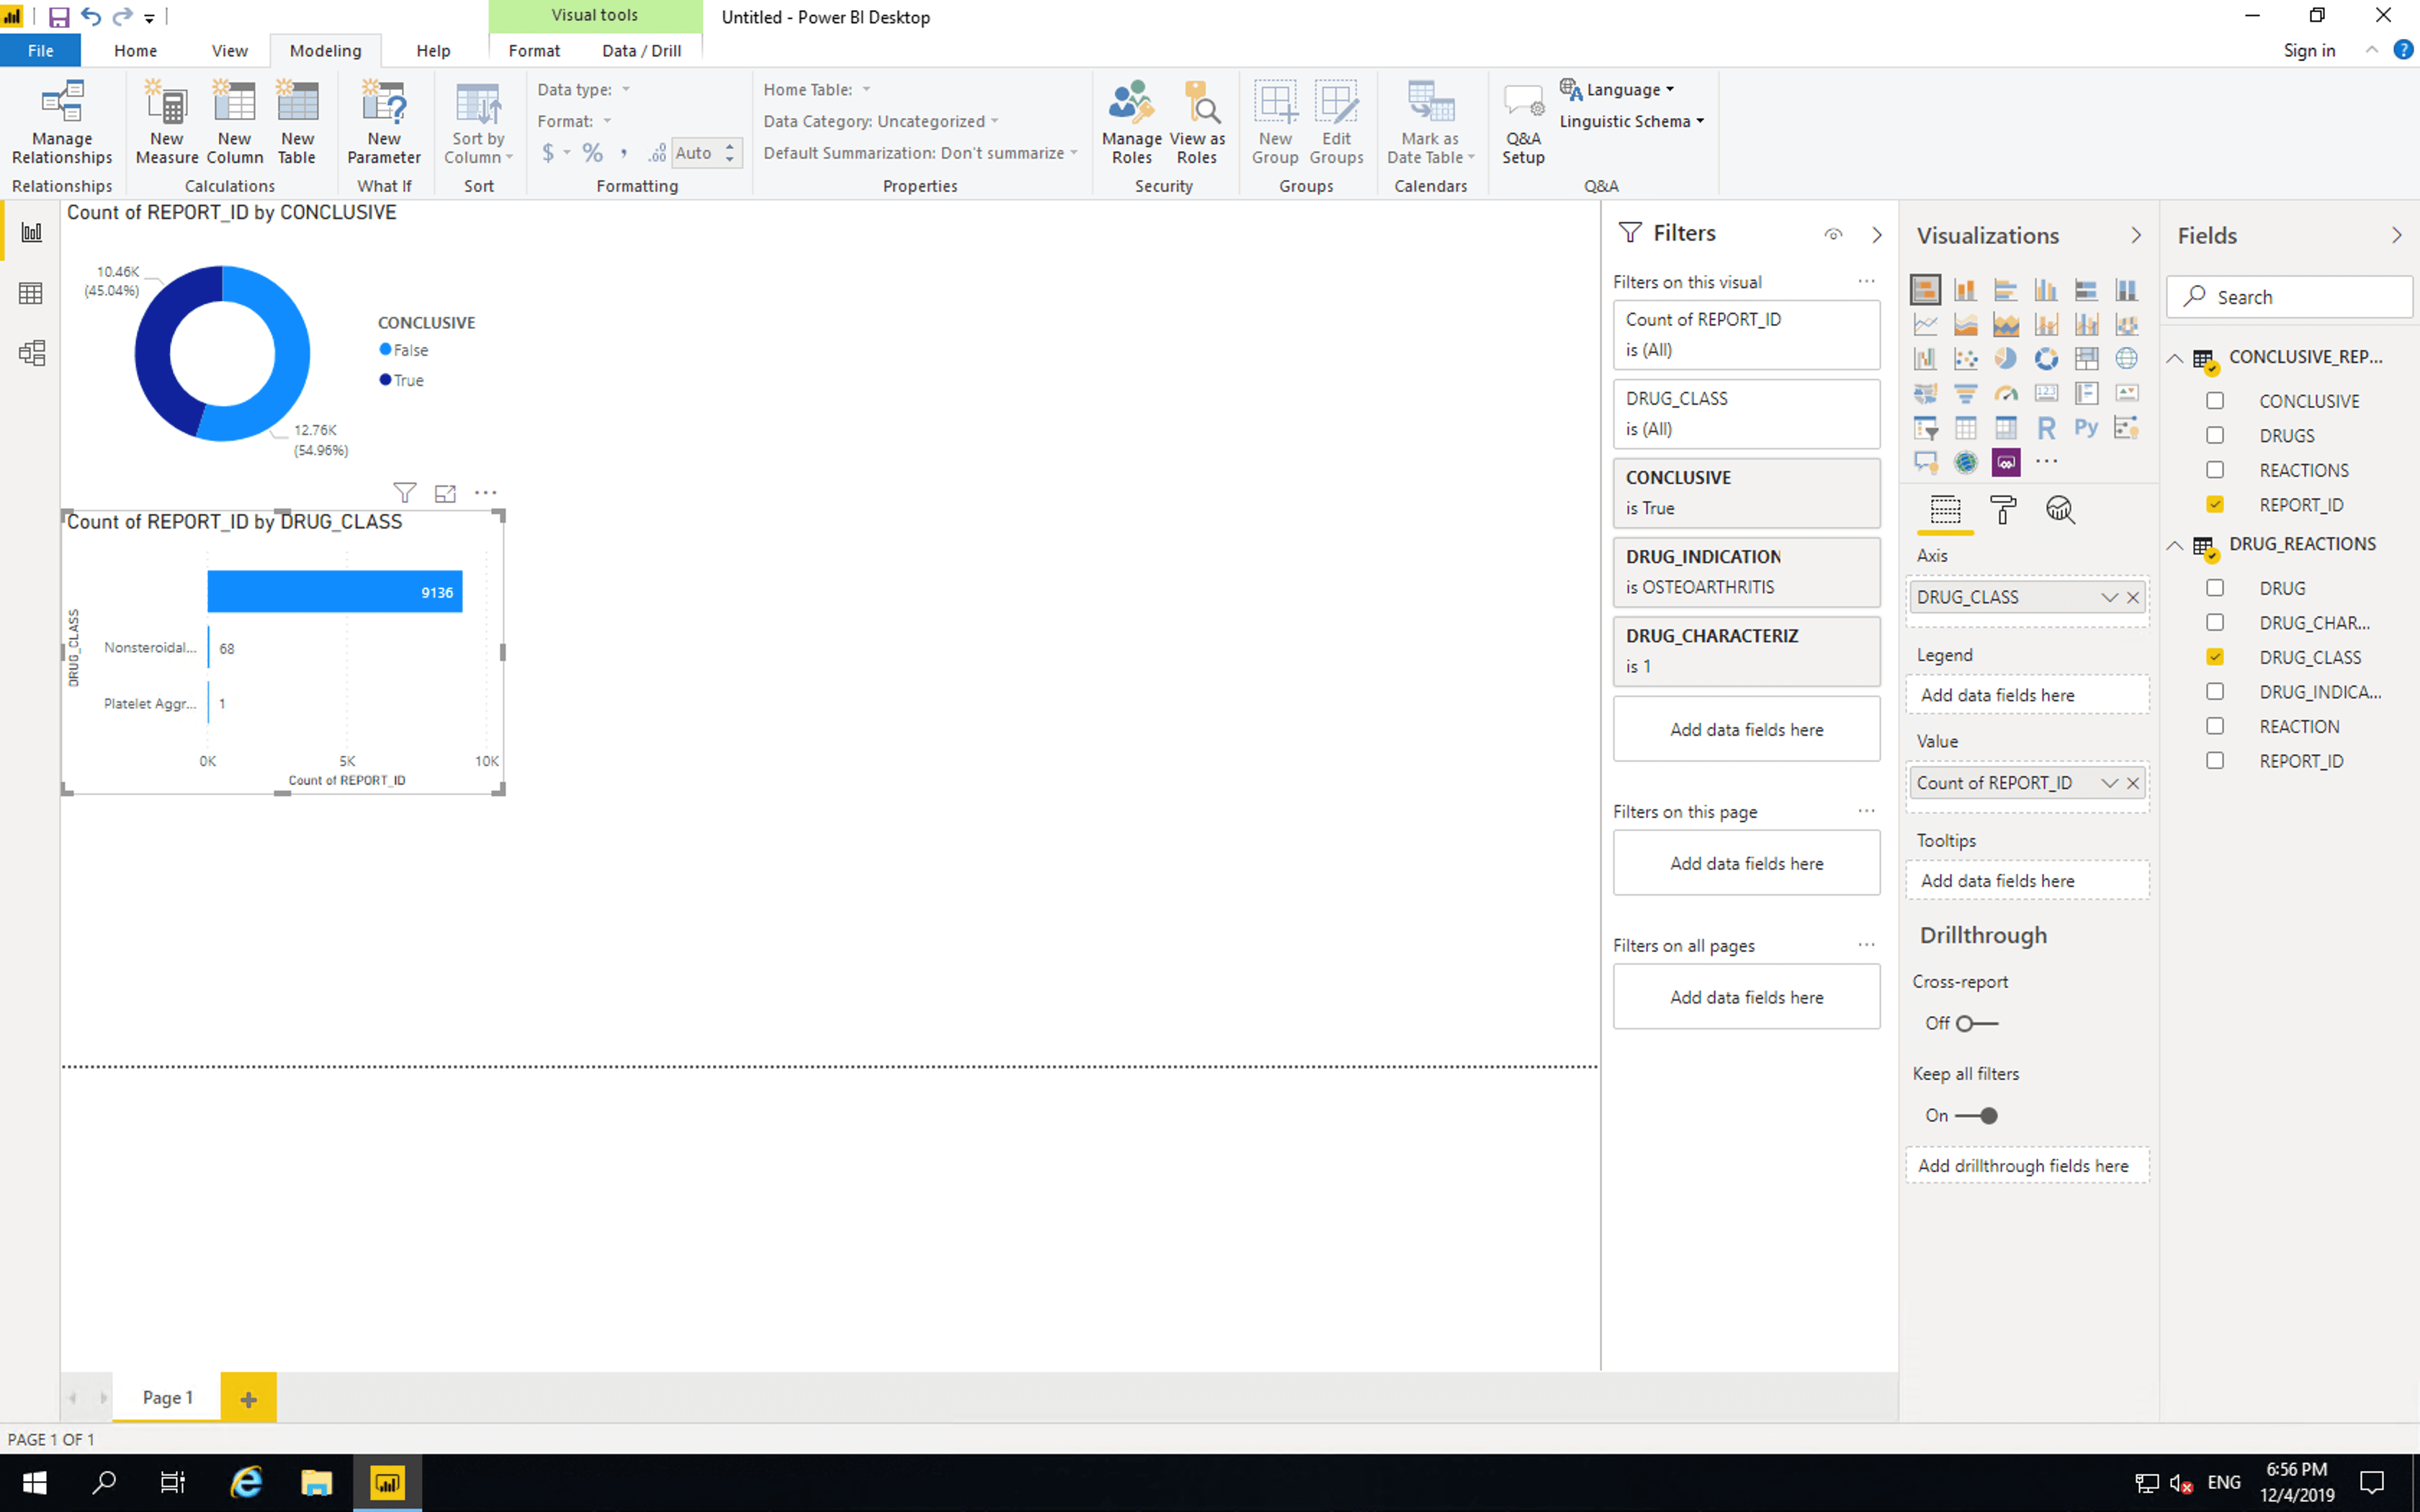
Only two drug classes are listed. There are 9136 reports containing drugs with no drug classification information. Out of the drugs whose pharmaceutical classes are included, 68 are NSAIDs and 1 is a Platelet Aggregation Inhibitor.
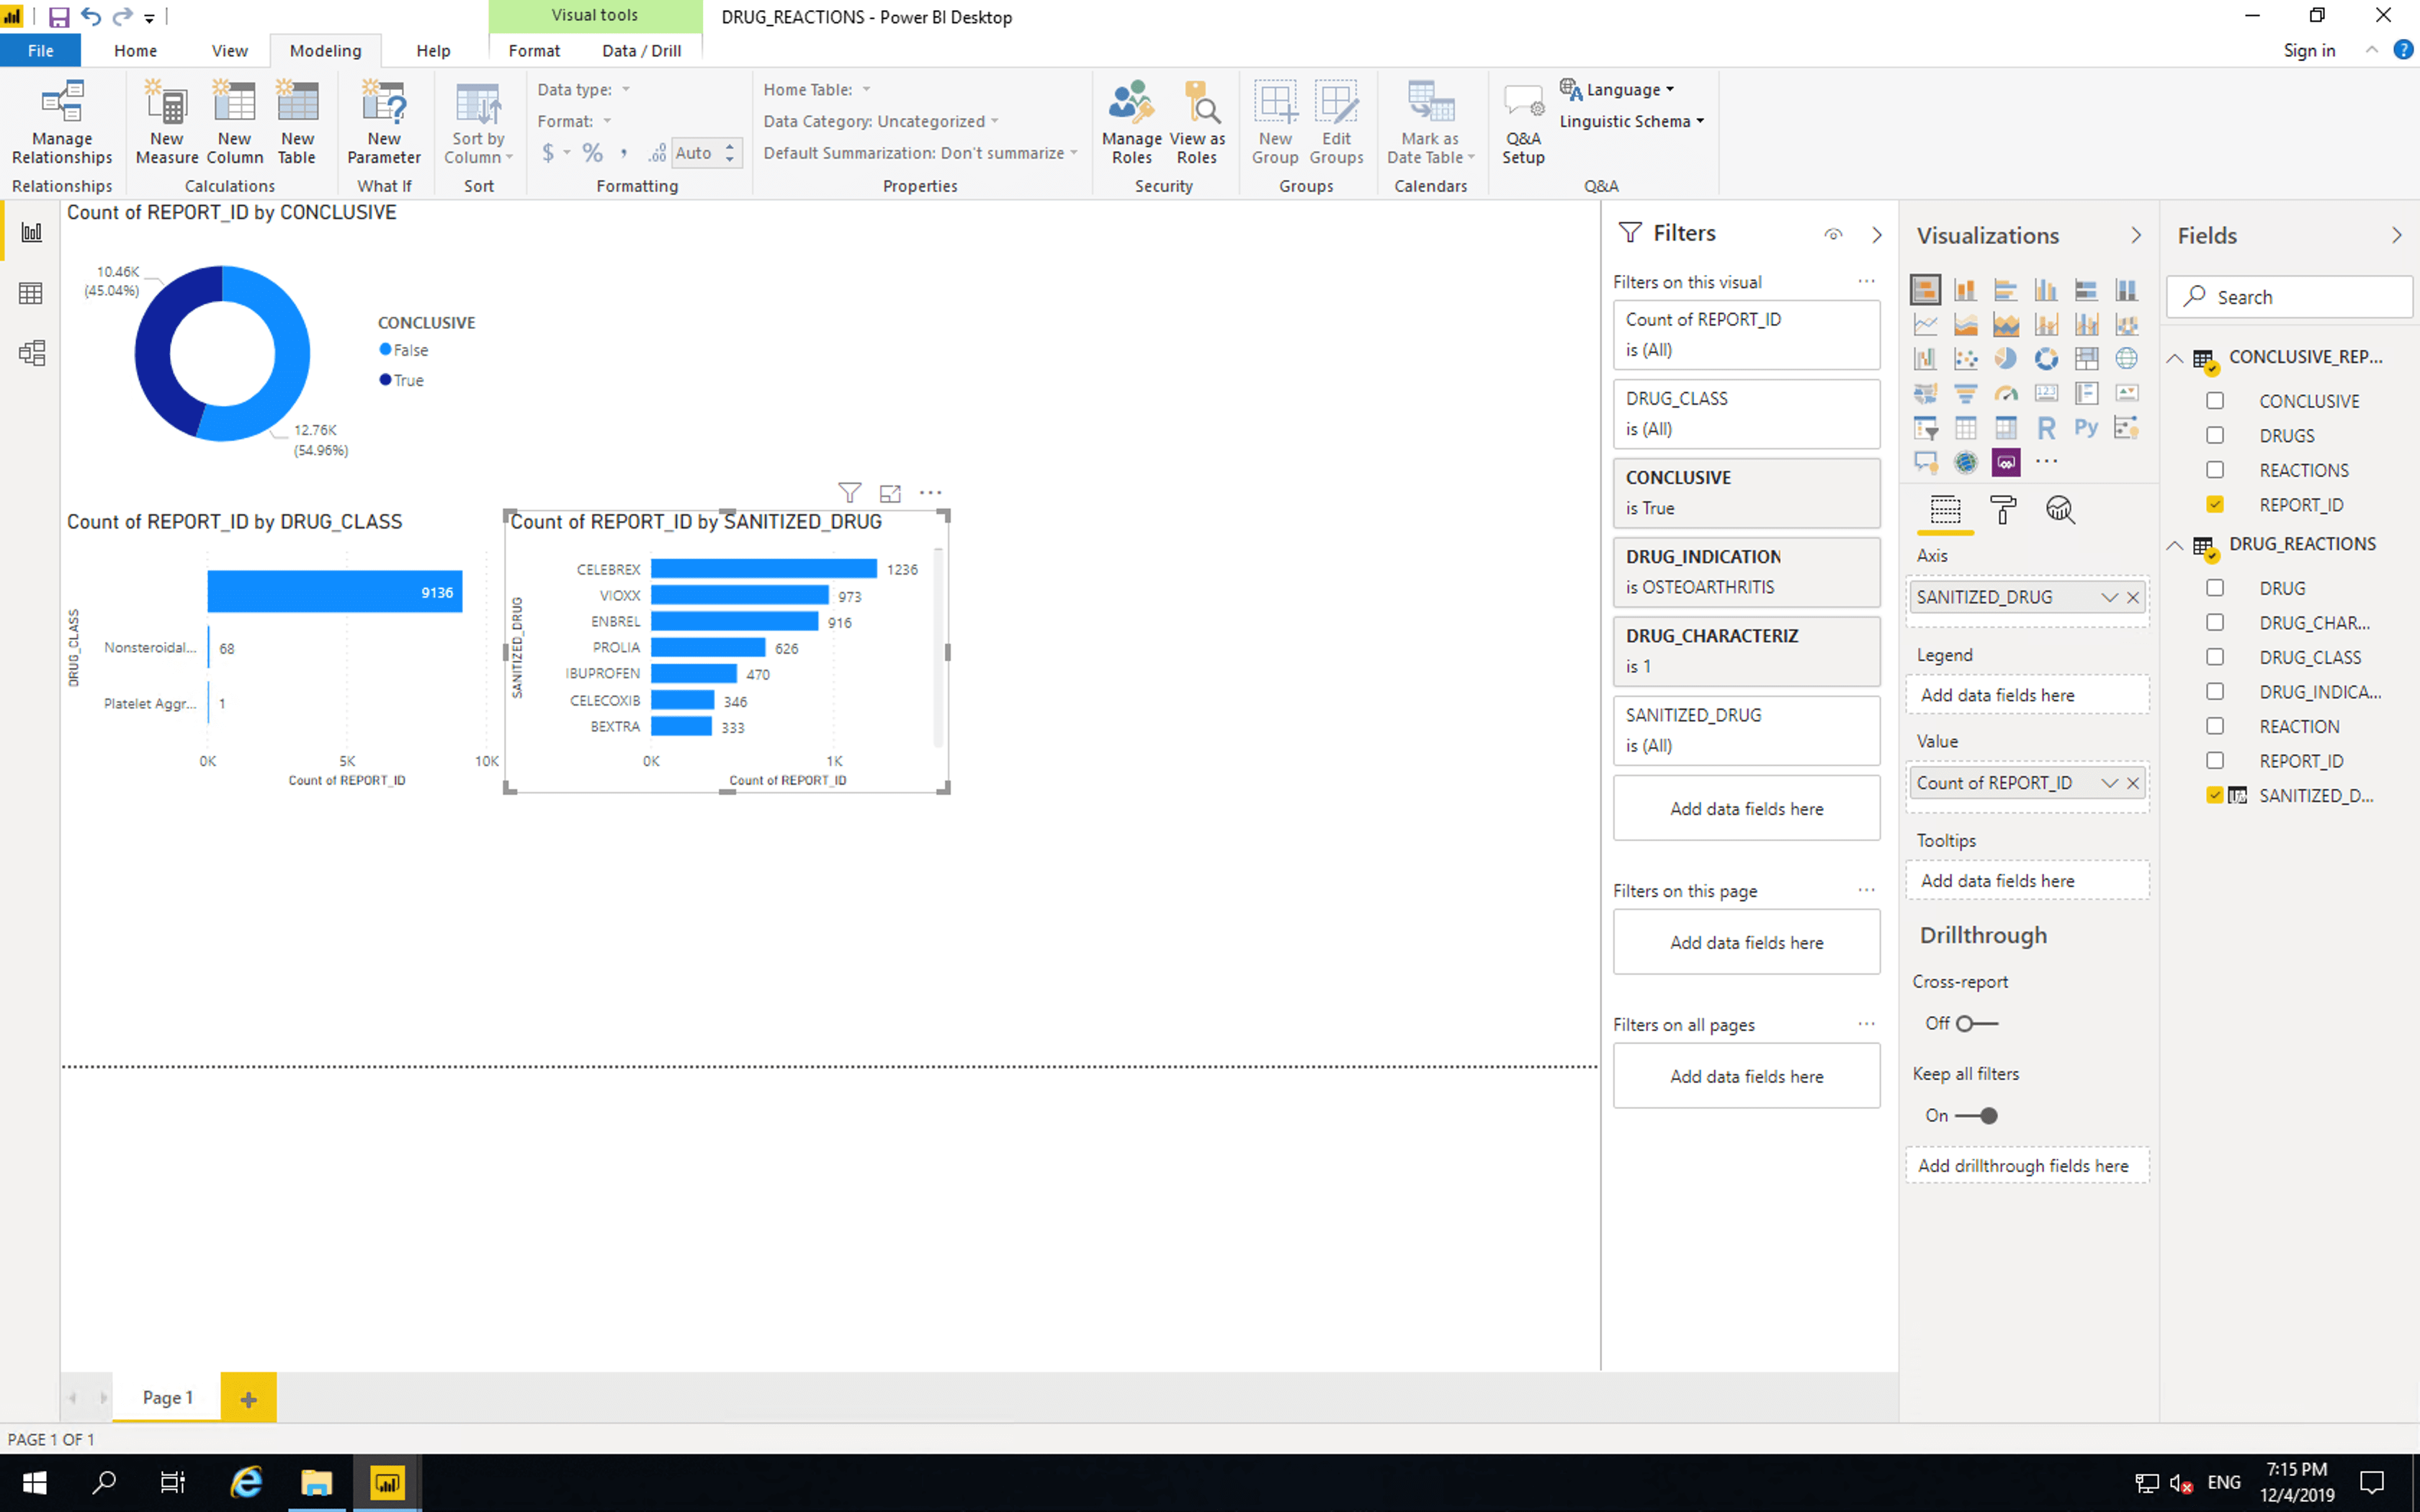
Next let’s drill into the drugs themselves. Copy and paste the bar chart and replace DRUG_CLASS with DRUG. This shows some drug names containing full stops which we should remove.
Right click on DRUG_REACTIONS and click “New column”, paste the following then replace DRUG with SANITIZED_DRUG in our newest bar chart.
SANITIZED_DRUG = SUBSTITUTE([DRUG],".","")
The position of drugs in these tables does not mean they are more or less dangerous than each other, as there are many factors that affect reporting of adverse events. Please refer to the important disclaimer.
This table shows that as expected the majority of reported adverse reactions involving drugs indicated for osteoarthritis are NSAIDs. NSAIDs are often prescribed for osteoarthritis. Also included in this list are a TNF inhibitor, a monoclonal antibody and a gabapentinoid.
Other drugs which are often prescribed for osteoarthritis include acetaminophen and opioid analgesics, however these don’t feature prominently in our chart. This may be the result of reporting practices.
Vioxx is an NSAID which was approved by the FDA in 1999 and voluntarily removed from the US market in 2004 due to concerns about risks of heart attack and stroke. Despite only being on the market for a short period, it is prominently featured on this list. Bextra (also known as Meloxicam) is an NSAID which was approved by the FDA in 2001 and removed from the US market by the FDA in 2005. The other drugs in this list are approved at the time of writing.
Celebrex (celecoxib), Voltaren and Ibuprofen are NSAIDs. Celebrex is reported as the suspected cause of adverse reaction more than twice as often than Ibuprofen. Some organisations, such as Best Practice Advocacy Centre New Zealand state that “A significant benefit of celecoxib is that it is associated with less risk of gastrointestinal bleeding compared to non-selective NSAIDs”. Let us see if the BPACNZ statement is reflected in this dataset.
Copy and paste the last bar chart and replace SANITIZED_DRUG with REACTION. Then drag SANITIZED_DRUG to “Filters on this visual”. Search for “Celebrex” and select all drugs that only contain Celebrex. Search for “Celecoxib” and select all drugs that only contain Celecoxib. Avoid values marked as “Blinded” and values that contain drugs other than Celebrex and Celecoxib.
Copy and paste the Celebrex reactions bar chart, click “Select all” then select all drugs that only contain Ibuprofen. Avoid values marked as “Blinded” and values that contain drugs other than Ibuprofen.
Then for each of the two newest bar charts select them and click “Table”.
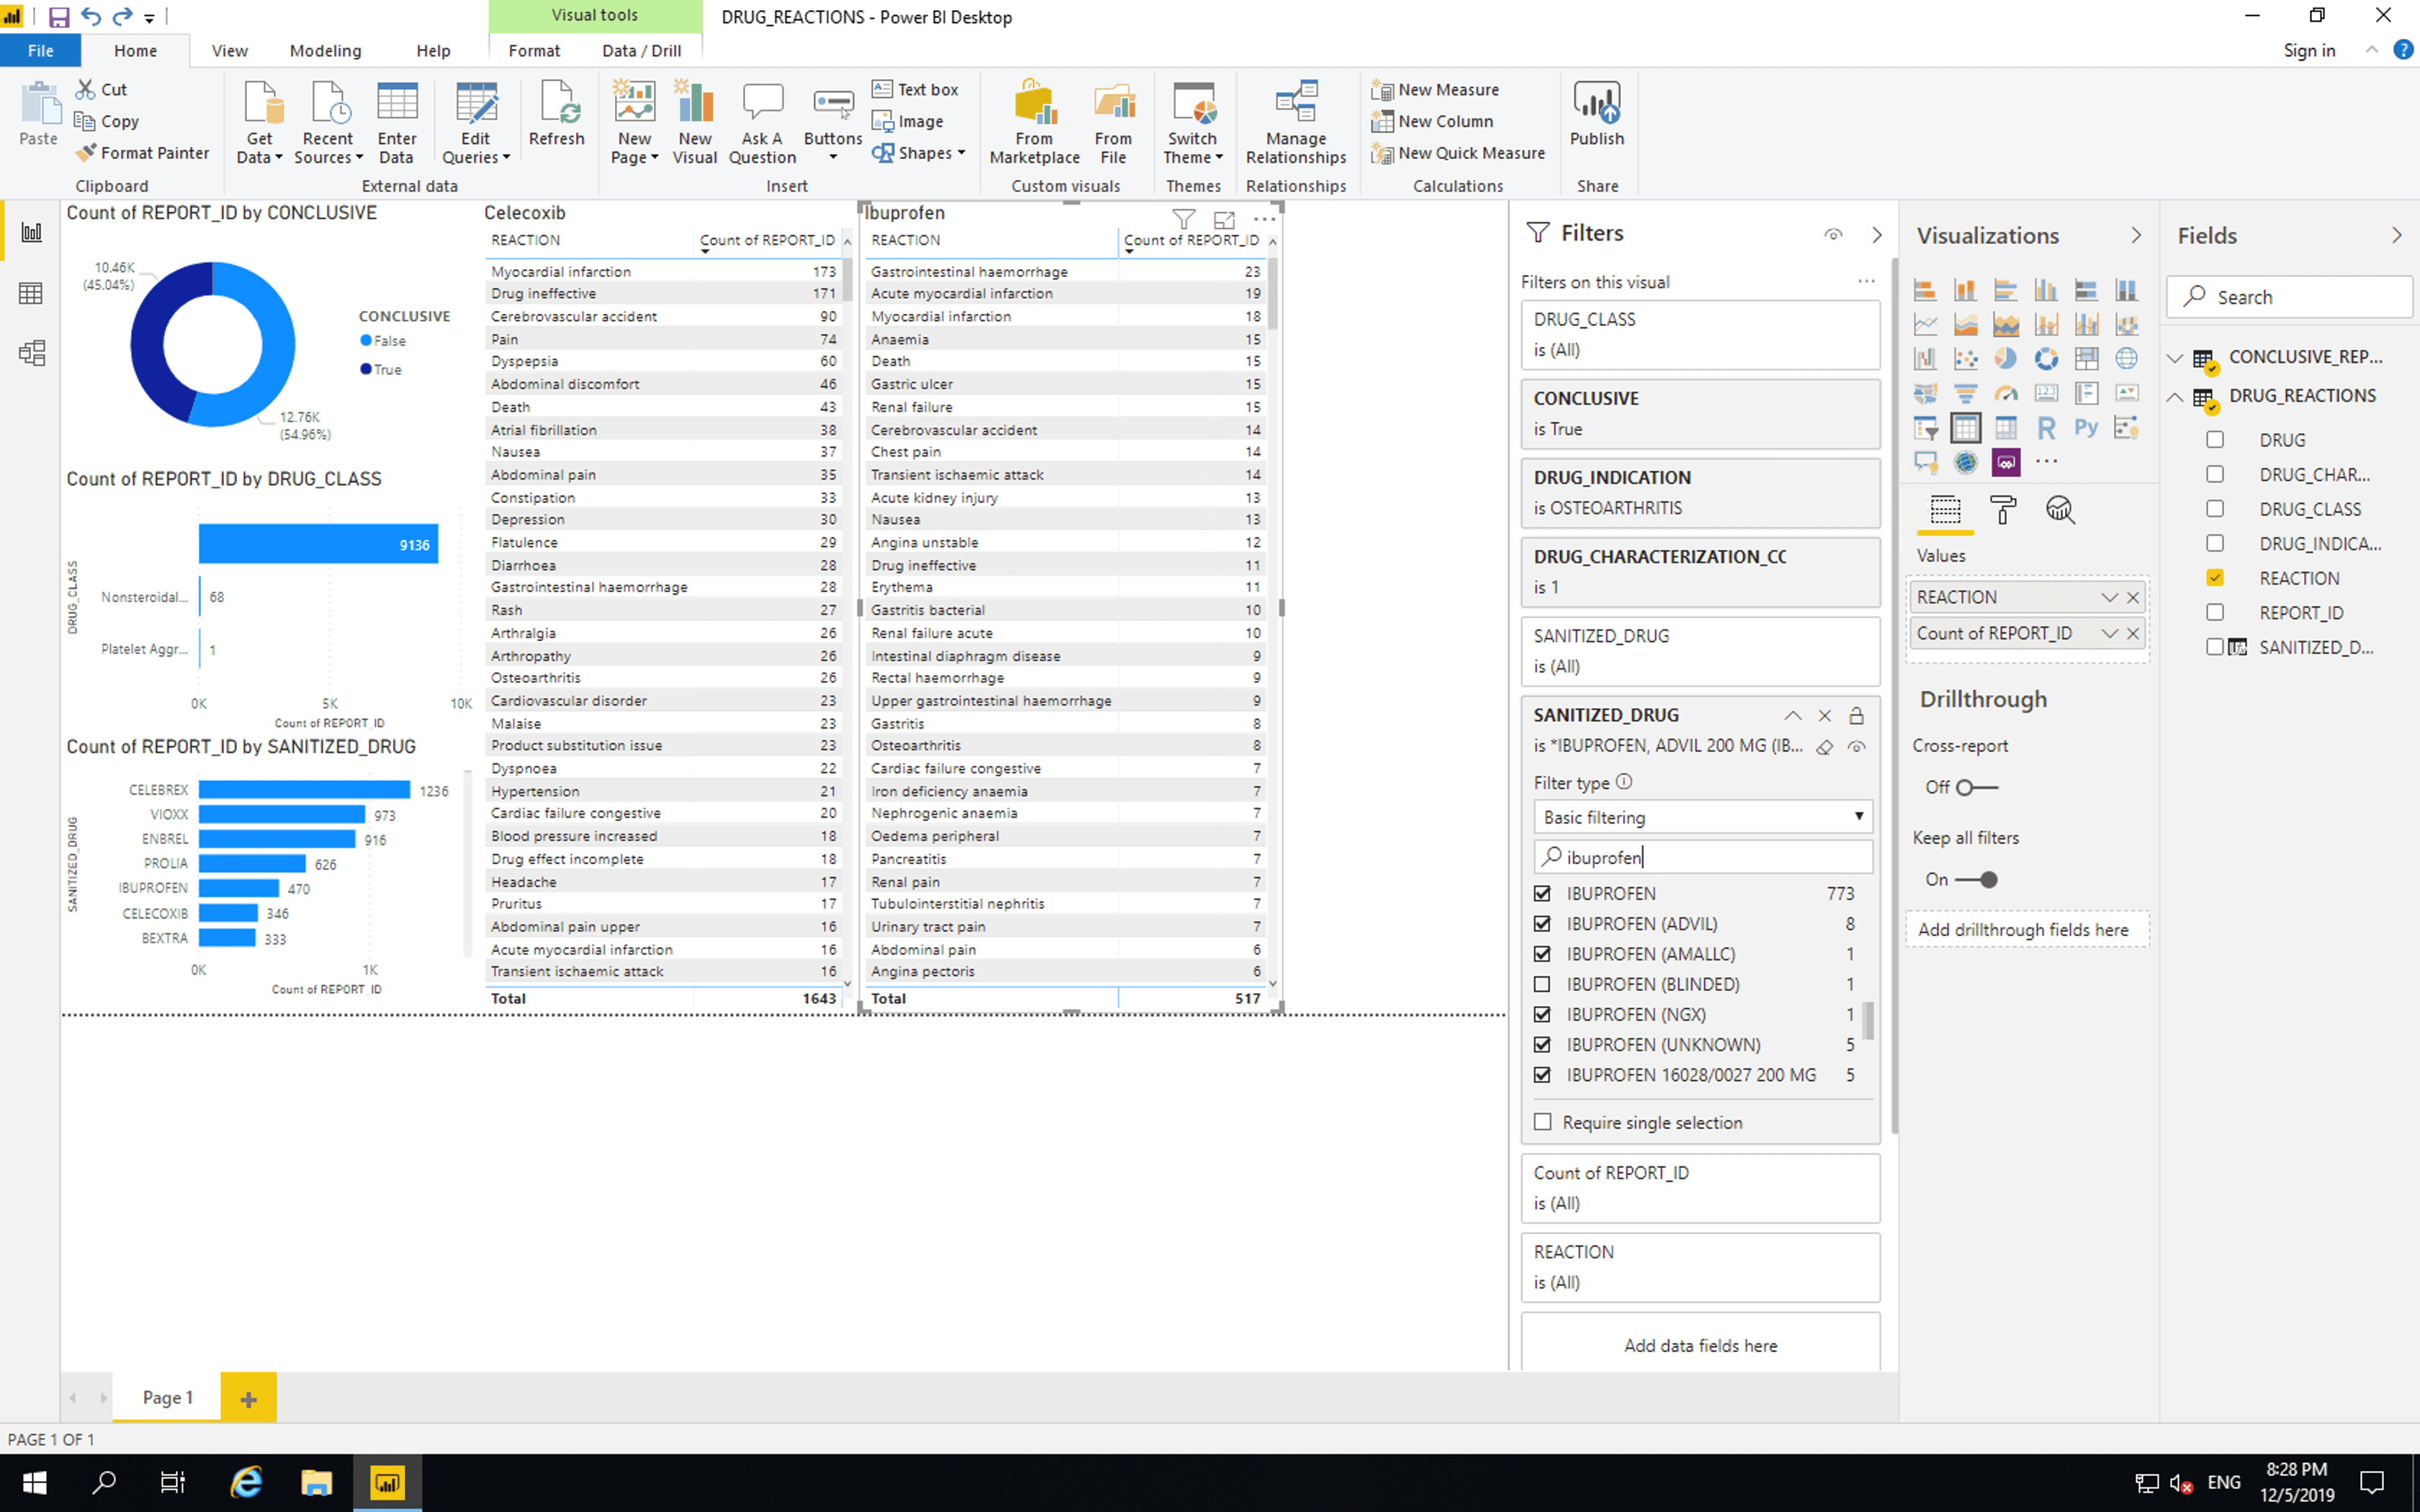
Gastrointestinal bleeding is the 15th most reported adverse event where Celebrex is suspected and the 1st most reported adverse event where Ibuprofen is suspected. This seems to reflect BPACNZ’s statement, however, there are many possible causes for these results. These results should not be used to make decisions about medical care.
Let’s summarize our insights into adverse reaction reporting of drugs indicated for osteoarthritis.
- Out of
23217reports, only10457could be used to conclude that a given drug is suspected to be responsible for a given reaction. - Out of the
10457resulting reports only246contained drug classification information. - There are more than twice as many adverse reaction reports where Celebrex is suspected as responsible than there are where Ibuprofen is suspected as responsible.
- Gastrointestinal bleeding is the 15th most reported adverse event where Celebrex is suspected and the 1st most reported adverse event where Ibuprofen is suspected.
- Despite being on the market for a short time Vioxx and Bextra are listed in the top 10 most reported drugs.
Research into the causes of these insights could lead to preferable patient outcomes and more valuable adverse event reporting.
In just a few minutes we’ve connected, tabulated and gained insights from paginatated non-tabular Web API data with Precog and Power BI.