")
The most ubiquitous report in the marketing world is Google Analytics‘ “Users” report. It’s the first report you bump into when you log into Google Analytics. It simply shows you the number of discrete users coming to your site.
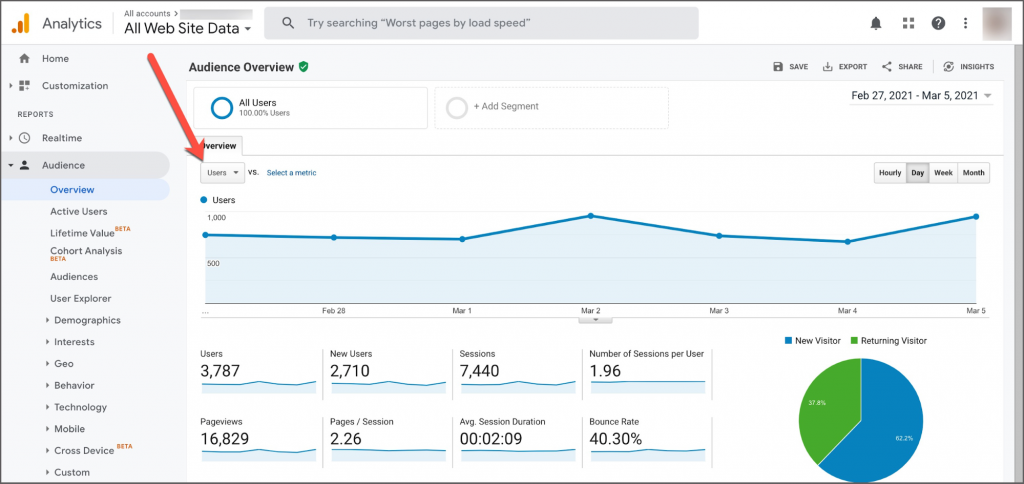
But what happens when you want to see a report that combines traffic from more than one site — one that rolls up or combines multiple websites (or “Properties” in Google Analytics jargon)?
Lots of companies (and especially the marketing agencies that service them), have groups of sites that really represent one thing. An example: a company with a number of locations that use slightly different domain names (store1.com, store2.com, store3.com).
To do the roll-up right now, there are two options:
- Pay for Google Analytics 360
- Download each report and then combine them into one report — a static report, that is.
Option 1 is tens of thousands of dollars (if not more than $100k).
Option 2 is manual labor. Can you imagine combining X sites every day to power a simple line chart? Nope. It won’t get done.
The new, better way — Option 3 — is to stream the data from Google Analytics’ API into a BI tool where you can transform the data dynamically. It’s a one-time set-up using Precog and then you’re done.
Here’s the basic workflow:
- Connect to Google Analytics
- Combine the data in Power BI
- Set the refresh rate/interval
This no-code recipe scales nicely and only requires Precog and Power BI license. You can also use other BI tools. Here is the one-time set-up:
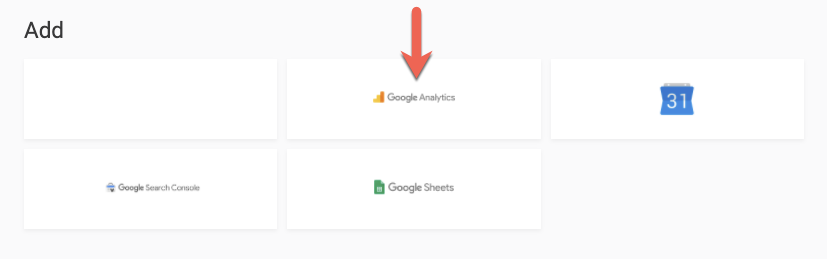
Step 1: Add Google Analytics As A Source In Precog
Go to Sources in Precog and click on Google Analytics. Next, fill out the basic fields. Name the source “Website 1” or whatever you want. Repeat this step for each site you want to be included in your roll-up. You can add as many as you want.
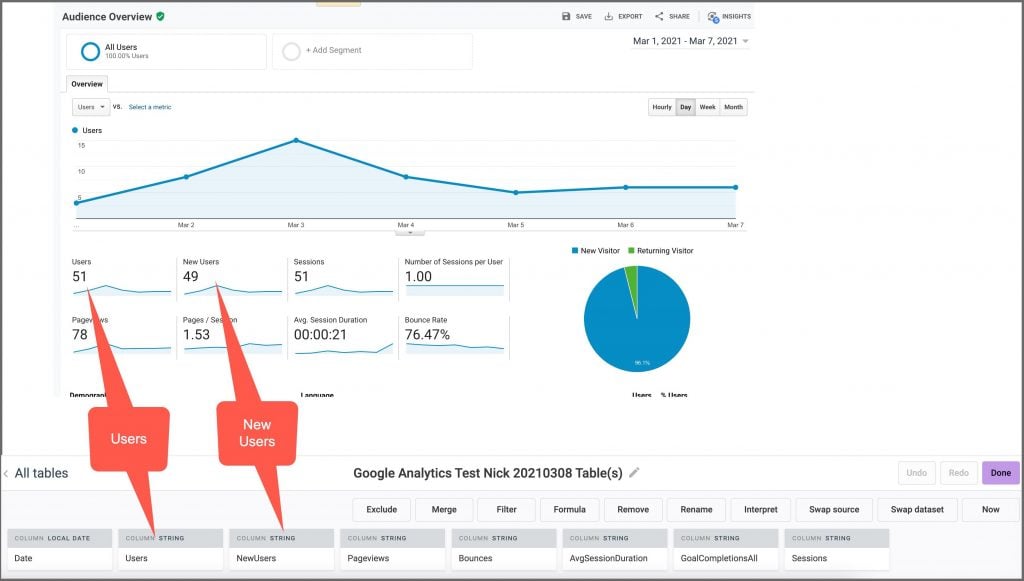
Step 2: See Automagically-Selected Data
Precog’s magic is that it detects available “tables” and makes then for you automatically. Even though the data is behind the API is JSON, Precog delivers what most analytics apps require: tables.
Step 3: Send Your Data to Power BI
At this point, you could simply download your data. But Precog allows you to make it accessible directly from BI tools.
Go to Destinations and select “Power BI / Tableau / Looker / etc”.
Under the hood, the data is downloading to a Postgres database. There’s no coding, though.
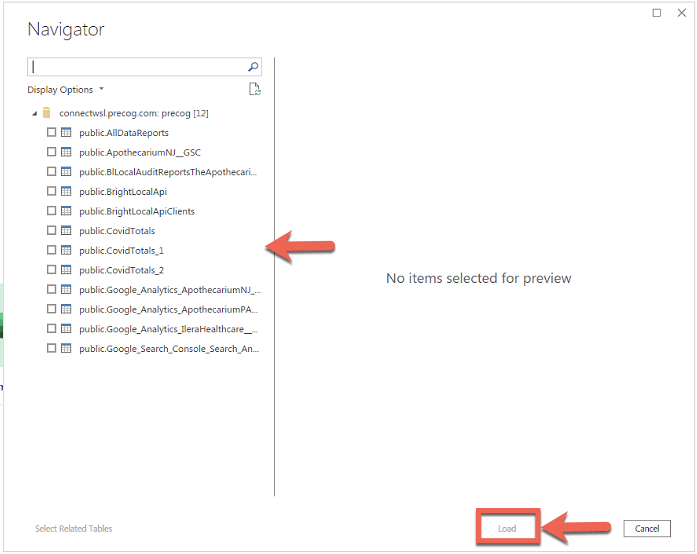
Click “Load” for each of the new datasets. This will load the latest data from your Google Analytics account(s) into Precog.
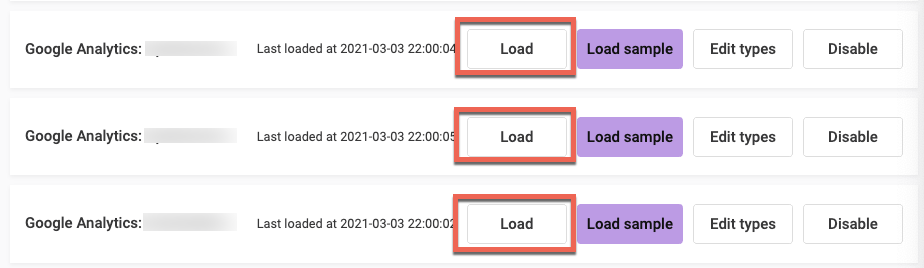
Your data is now ready to be used from Power BI.
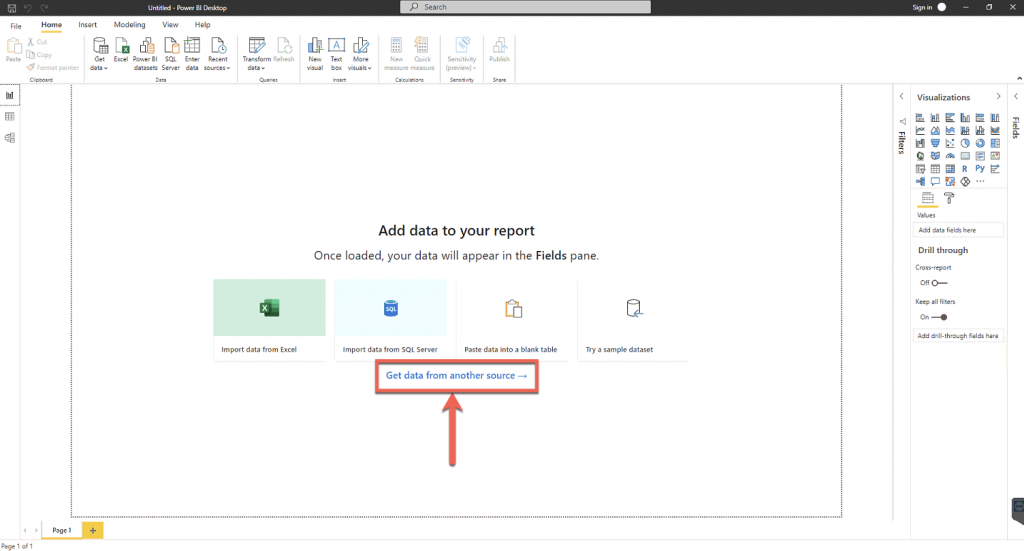
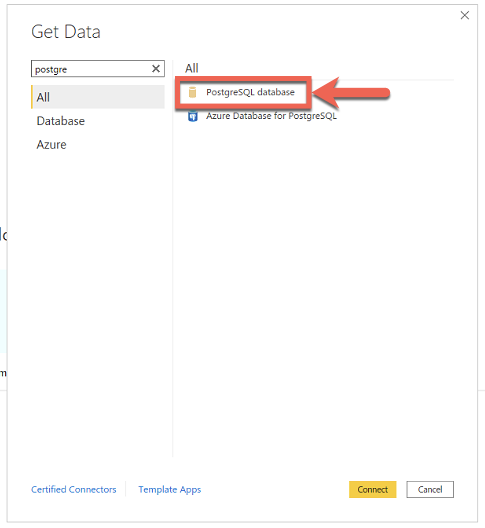
Step 4: Add Precog As A New Source In Power BI
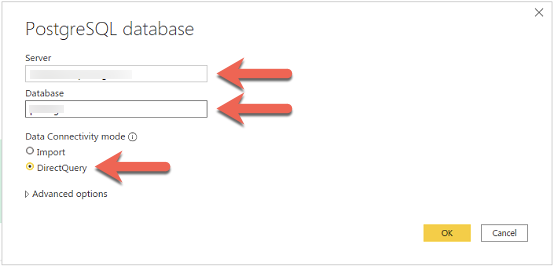
Open Power BI, create a new report, connect to your account’s Postgres database on Precog using your credentials, and select DirectQuery. Select the tables you want to use.
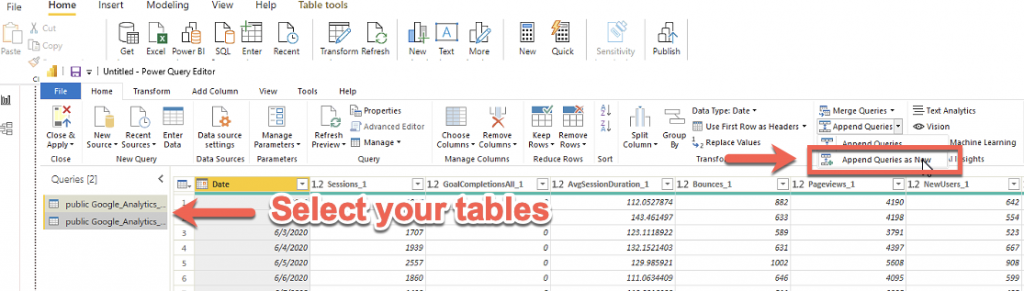
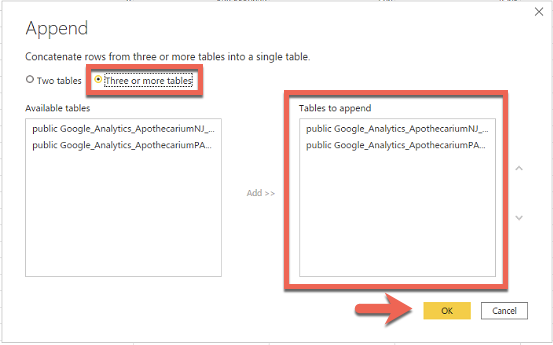
Step 5: Combine Your Properties (Websites) Into A New Table
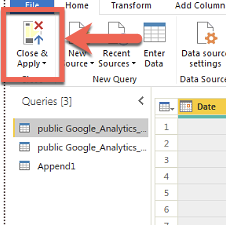
To combine data from different tables into the same report, use the Power Query editor, select your tables and click on “Append Queries as New ” option. Close and apply.
![]()
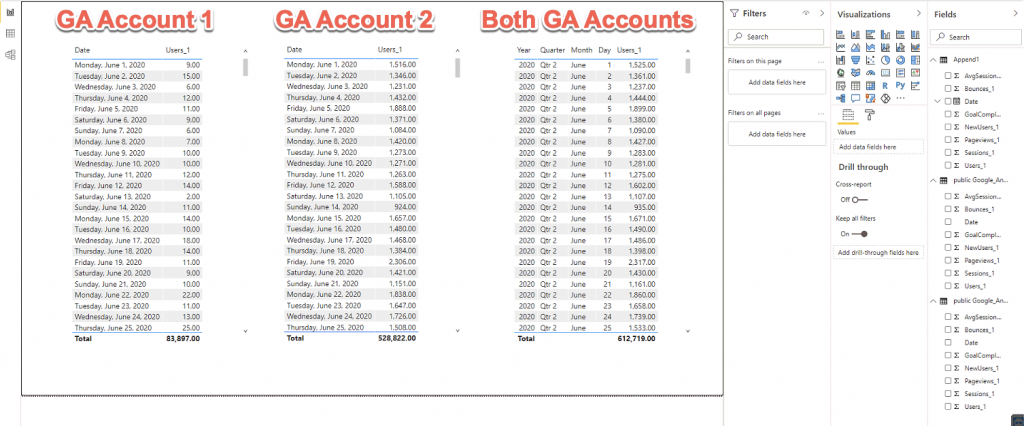
Step 6: Validate Your Data
You can do a quick check to confirm the numbers add up. Then you can build your visualization.
Step 7: Configure Data Refresh In Precog
To automatically load new data, click on “Schedule” in Precog and set the interval for when data is pulled from Google Analytics and stored in Precog.

From within Power BI, you can simply hit refresh to grab the latest data – and your visualization will automatically update.
Summary: No-Code Custom Google Analytics Reports
Google Analytics isn’t a database — it’s an API. Precog’s unique value is that it sees an API as a database — or simply a set of tables. Once you grasp this key innovation, you can start to see that you can access almost any data source without needing a developer. Getting access to the raw data is a big step towards faster analysis. No need to pay big fees for custom reports either.
Let us know how it worked out!