Consolidated AWS GuardDuty security analytics using Precog and Tableau
AWS GuardDuty is an Intelligent Threat Detection and monitoring service. The service uses machine learning, anomaly detection, and integrated threat intelligence to identify and prioritize potential threats.
However, due to how GuardDuty captures and stores logs, creating a consolidated GLOBAL security view can be a challenge. Working with our partner Tableau, and using the advanced transformation solution Precog, we have delivered a fully packaged solution that lets anyone using GuardDuty create a global security dashboard in under an hour! The following post explains how the solution lets a user quickly create a single logical volume across all GuardDuty data and then transform it into Tableau ready tables in minutes using the prebuilt templates in Precog.
AWS Regions and challenges with GuardDuty
As a threat detection service, GuardDuty analyzes tens of billions of events across multiple AWS data sources, such as AWS CloudTrail, Amazon VPC Flow Logs, and DNS logs. Alert monitoring and operational dashboards can be addressed by any number of security platforms in near real-time fashion. In contrast, security analysis draws upon selective review of pertinent data from the full body of data. Analytics will support decision-making that influence factors such as security posture, proactive strategy, and cost.
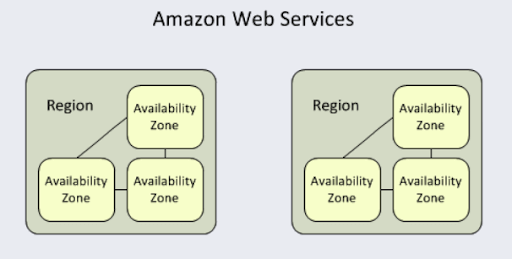
Two characteristics of GuardDuty export data impacts the manner in which data is received for analysis. First, GuardDuty data is exported in JSON format. Second, GuardDuty is region-specific. For the 20+ regions in AWS, GuardDuty monitors security events within a given region and does not aggregate events across multiple regions.
National and international organizations that utilize more than one region are faced with a cumbersome process of having to aggregate data in order to get a “big picture” view of security across multiple regions.
A broad, multi-region view can lend toward some of the following use cases:
- Determine alignment, implementation, and effectiveness of corporate-wide policies and practices.? This could affect the roll out of security solutions, or have an impact on hiring practices in specific regions.
- Review cost and infrastructure strategies across regions in light of systems that appear to be most vulnerable to high severity events.
- Develop strategy for policy, security solutions, best practices, and training that would have the greatest impact across the organization based upon the multi-region perspective.?
Challenges with Semi-structured Data
The use of JSON data is on the rise, and understandably so.? The semi-structured JSON format enables quick distribution of application and system data without time-consuming, maintenance-intensive schemas.? As a result, JSON files can be both very large and heavily nested with multiple objects and multiple arrays. Parsing complex JSON files amounts to having to potentially address each data set as a unique structure.? Even if the JSON comes from the same source, the format allows for a change in data type and the size of data elements, often requiring adjustments to customized scripts. Beyond the notion of a single data source, the potential of having multiple disparate data sources will add complications to the data prep process.? The following example of AWS GuardDuty JSON data is from the US-West region.
},
????”severity”: 8,
????”createdAt”: “2019-06-18T08:27:00.976Z”,
????”updatedAt”: “2019-06-18T09:02:22.095Z”,
????”title”: “i-0fdbd9b8f9513f225 is performing SSH brute force attacks against 172.16.0.29. “,
????”description”: “i-0fdbd9b8f9513f225 is performing SSH brute force attacks against 172.16.0.29. Brute force attacks are used to gain unauthorized access to your instance by guessing the SSH password.”
??},
??{
????”schemaVersion”: “2.0”,
????”accountId”: “620315511512”,
????”region”: “us-west-2”,
????”partition”: “aws”,
????”id”: “bab5b4d925f8541f7eee331dbcee75e9”,
????”arn”: “arn:aws:guardduty:us-west-2:620315511512:detector/feb5b4d526bee5e04848a2db0e2f7293/finding/bab5b4d925f8541f7eee331dbcee75e9”,
????”type”: “Recon:EC2/Portscan”,
????”resource”: {
??????”resourceType”: “Instance”,
??????”instanceDetails”: {
????????”instanceId”: “i-0fdbd9b8f9513f225”,
????????”instanceType”: “m4.large”,
????????”launchTime”: “2019-06-17T20:54:09Z”,
Address Challenges with a Single Product
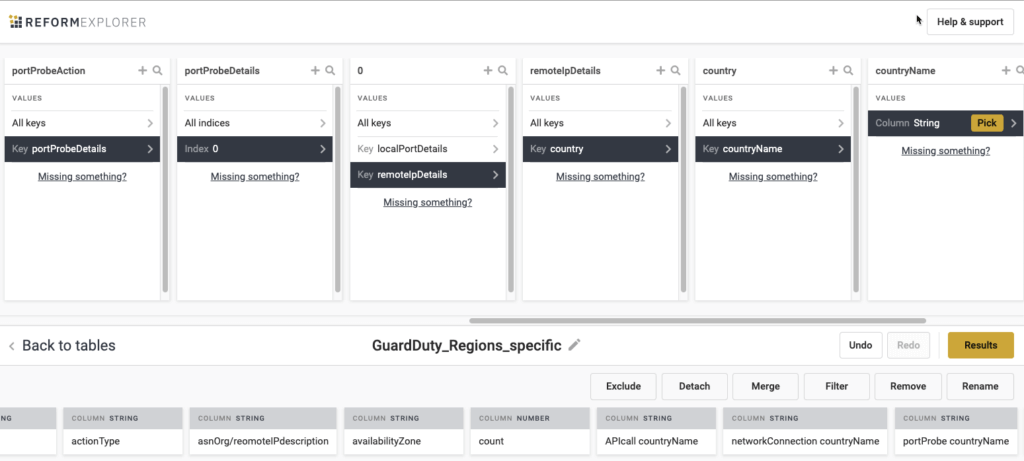
Engineered to transform variable, complex JSON data, Precog draws source data from file output, API URLs, and data repositories such as AWS S3 and Azure Blob Storage.? JSON formatted data is transformed to flattened tables where the data can then be ingested for analysis by Tableau. Building tables is a simple matter of browsing and picking the data of interest.? In the following screenshot, the user picked the country name of the remote IP address associated with a threat.
Beyond transformation, data can be prepared for analysis by aggregating disparate sources into a single unit of data for analysis.? Typically, this aspect of data preparation has been addressed in a couple ways. One way would be to create tables and schemas, then perform joins using standard SQL commands or Tableau.? The other way would be to ?brute force? data into a single unit through scripting, copy and paste, or generally by means of some manual effort. In contrast, multiple data sources can be aggregated in Precog.? Similar data objects will have values reflecting merged content without having to work through additional steps once the tables are built.
Visualizing GuardDuty Data with Tableau enabled by Precog
Operationally, the alerts generated by GuardDuty should be acted upon swiftly ? as close as possible to the time of the event itself.? Strategically, analysis of GuardDuty alerts will enable an organization to make adjustments and set a proactive course. However, simply having access to a large pool of data is insufficient for strategic analysis.
The capacity to readily select data of interest in a timely manner is of critical importance.? Not all data applies to specific stories. Having the ability to pull the right data and to know the data preparation solution can adjust to changes in the data (e.g. a change in the length of the field) is important when working with data sources that are not static.? Additionally, having the ability to easily remove or select additional fields of data for analysis allows an analyst to respond to changing conditions or new lines of inquiry. Precog Precog is engineered to prepare and transform JSON data from multiple sources. The UI browser puts control of the flow of the right data into the hands of the analyst.? Tabular output from Precog is uploaded in Tableau where the analyst can work magic around trending, powerful dashboard-like reports, and decision-enabling graphs.
For more information or a full demonstration of this solution email [email protected]